617 N State St Bellingham, WA 98225
Sehome NeighborhoodEstimated Value: $758,000 - $1,397,000
About This Home
FREE SEPTEMBER RENT
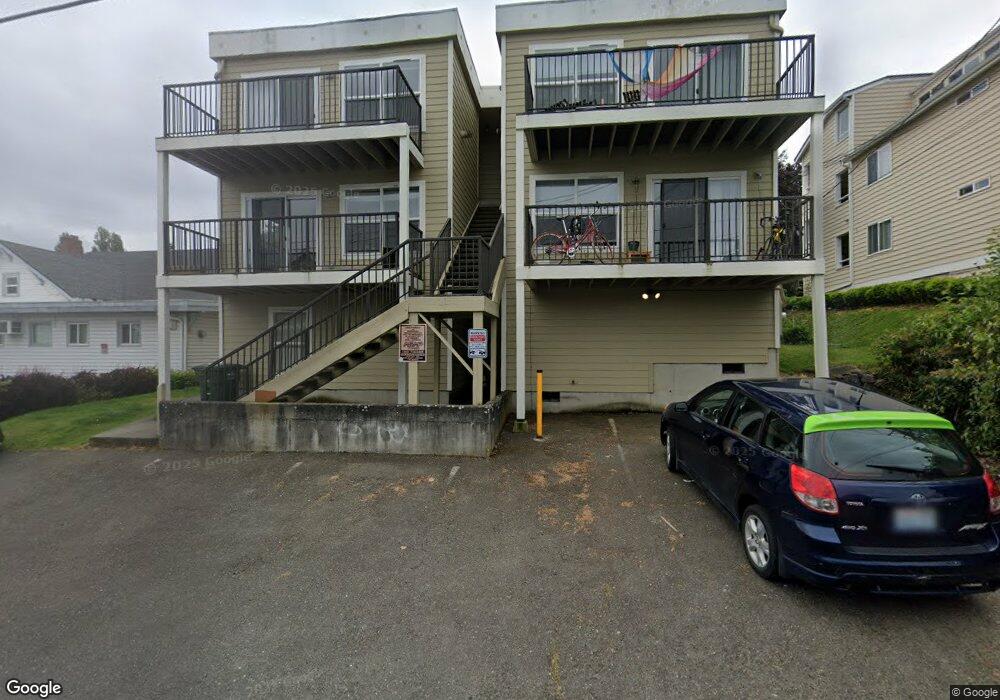
DOWNTOWN- 617 State Street - A huge deck provides the ideal spot for gazing across Bellingham Bay each evening at sunset. The outdoor space alone makes this complex special, but that's only the beginning. Laid out perfectly, the 2 bedroom units have a large full bathroom, a well-designed kitchen with a generous amount of counter space, as well as multiple ample closets. Oversized windows throughout offer bright natural light on sunny days, and a gas fireplace gives the living/dining room a cozy feel on those Pacific Northwest cloudy days. Whether heading to WWU or downtown, 617 N. State St. is minutes away from both in this perfectly located complex in the center of it all.
Available: August 16, 2024
2 Bedroom
1 Bathroom
860 SF
On-site laundry
Dishwasher
Microwave
Gas Fireplace
Electric Cadet Heaters
Rent amounts listed do not include any utilities.
An additional $60/per unit will be charged per month to cover water/sewer/garbage use. This amount will be charged in addition to rent.
Lots of Natural Light And Great City views
Large Deck With View
Storage For Bikes, etc. In Laundry Room
Unassigned Permit Parking
**please note pictures and videos may not reflect actual unit available. For specific unit details please call
Ownership History
Purchase Details
Home Values in the Area
Average Home Value in this Area
Purchase History
| Date | Buyer | Sale Price | Title Company |
|---|---|---|---|
| State Street Apartments Llc | -- | -- |
Property History
| Date | Event | Price | List to Sale | Price per Sq Ft |
|---|---|---|---|---|
| 09/09/2024 09/09/24 | For Rent | $1,750 | 0.0% | -- |
| 09/09/2024 09/09/24 | For Rent | $1,750 | -- | -- |
Tax History Compared to Growth
Tax History
| Year | Tax Paid | Tax Assessment Tax Assessment Total Assessment is a certain percentage of the fair market value that is determined by local assessors to be the total taxable value of land and additions on the property. | Land | Improvement |
|---|---|---|---|---|
| 2024 | $13,794 | $1,729,427 | $668,094 | $1,061,333 |
| 2023 | $13,794 | $1,773,459 | $685,104 | $1,088,355 |
| 2022 | $10,907 | $1,502,960 | $580,608 | $922,352 |
| 2021 | $10,700 | $1,174,187 | $453,600 | $720,587 |
| 2020 | $10,323 | $1,087,211 | $420,000 | $667,211 |
| 2019 | $9,724 | $1,013,835 | $399,600 | $614,235 |
| 2018 | $9,798 | $957,525 | $377,622 | $579,903 |
| 2017 | $8,532 | $824,877 | $324,540 | $500,337 |
| 2016 | $7,618 | $750,701 | $295,110 | $455,591 |
| 2015 | $7,636 | $697,758 | $278,370 | $419,388 |
| 2014 | -- | $676,778 | $270,000 | $406,778 |
| 2013 | -- | $662,441 | $265,500 | $396,941 |
Map
- 0 Pine St Unit NWM2445229
- 310 E Ivy St
- 414 Boulevard Unit 105
- 415 N State St
- 901 N Forest St Unit 107
- 901 N Forest St Unit 125
- 901 N Forest St Unit 109
- 819 High St Unit 317
- 1001 N State St Unit 403
- 616 E Myrtle St
- 615 E Myrtle St
- 1015 Railroad Ave Unit 418
- 1031 N State St Unit 107
- 1031 N State St Unit 209
- 1126 N Forest St
- 106 N State St Unit 106
- 1025 Granary Ave Unit 503
- 1025 Granary Ave Unit 404
- 1025 Granary Ave Unit 306
- 1025 Granary Ave Unit 506
- 615 N State St
- 618 Boulevard
- 616 Boulevard Unit 3
- 616 Boulevard Unit 4
- 616 Boulevard Unit 3
- 616 Boulevard Unit 2
- 616 Boulevard Unit 1
- 620 Boulevard Unit 101
- 620 Boulevard Unit 201
- 620 Boulevard Unit 101
- 620 Boulevard Unit 202
- 616 N State St
- 601 N State St Unit 101
- 601 N State St Unit 201
- 601 N State St
- 630 Boulevard Unit A & B
- 630 Boulevard
- 610 N State St
- 624 N State St