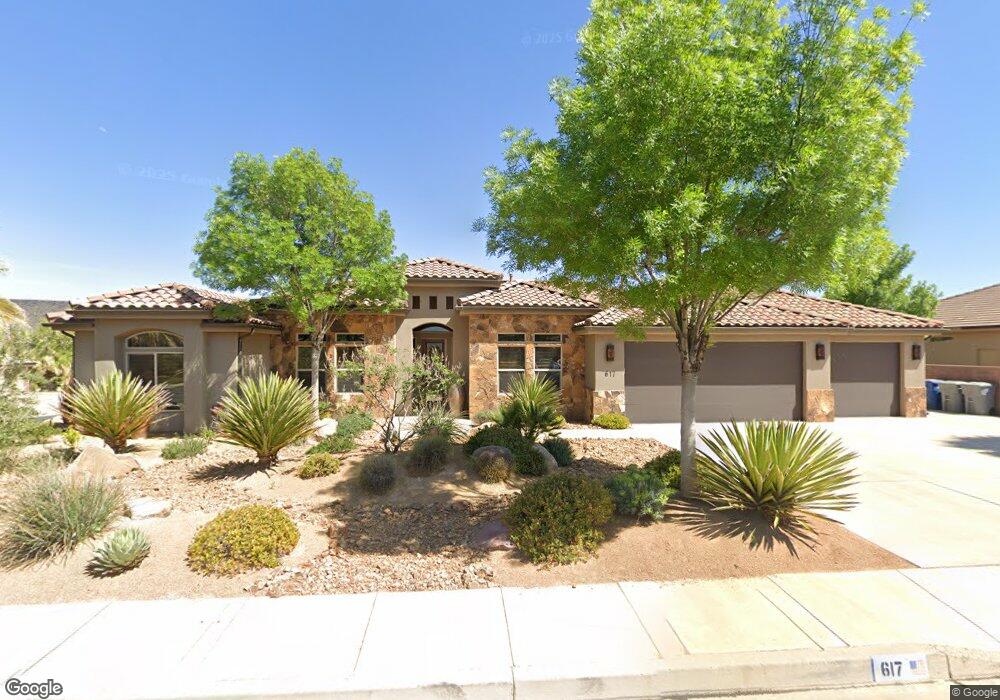
617 Rainier Dr Saint George, UT 84770
Estimated Value: $675,079 - $778,000
4
Beds
3
Baths
2,518
Sq Ft
$286/Sq Ft
Est. Value
About This Home
This home is located at 617 Rainier Dr, Saint George, UT 84770 and is currently estimated at $721,270, approximately $286 per square foot. 617 Rainier Dr is a home located in Washington County with nearby schools including Arrowhead School, Dixie Intermediate School, and Dixie Middle School.
Ownership History
Date
Name
Owned For
Owner Type
Purchase Details
Closed on
Jul 12, 2021
Sold by
Crabb Wayne Keith
Bought by
Crabb Suzanne Bennett and The High Desert Trust
Current Estimated Value
Purchase Details
Closed on
Jun 8, 2021
Sold by
Crabb Wayne K and Crabb Suzanne B
Bought by
Crabb Wayne Keith
Purchase Details
Closed on
Nov 30, 2011
Sold by
Crabb Wayne K and Crabb Suzanne
Bought by
Crabb Wayne K and Crabb Suzanne B
Purchase Details
Closed on
Jan 31, 2011
Sold by
Sweaney Jeffrey W
Bought by
Crabb Wayne K and Crabb Suzanne
Home Financials for this Owner
Home Financials are based on the most recent Mortgage that was taken out on this home.
Original Mortgage
$196,000
Outstanding Balance
$134,373
Interest Rate
4.82%
Mortgage Type
Purchase Money Mortgage
Estimated Equity
$586,897
Purchase Details
Closed on
Jun 2, 2010
Sold by
Qrs Development Inc
Bought by
Sweaney Jeffrey W
Create a Home Valuation Report for This Property
The Home Valuation Report is an in-depth analysis detailing your home's value as well as a comparison with similar homes in the area
Home Values in the Area
Average Home Value in this Area
Purchase History
| Date | Buyer | Sale Price | Title Company |
|---|---|---|---|
| Crabb Suzanne Bennett | -- | None Available | |
| Crabb Wayne Keith | -- | None Available | |
| Crabb Wayne K | -- | Accommodation | |
| Crabb Wayne K | -- | Guardian Title Insurance Age | |
| Sweaney Jeffrey W | -- | Southern Utah Title |
Source: Public Records
Mortgage History
| Date | Status | Borrower | Loan Amount |
|---|---|---|---|
| Open | Crabb Wayne K | $196,000 |
Source: Public Records
Tax History Compared to Growth
Tax History
| Year | Tax Paid | Tax Assessment Tax Assessment Total Assessment is a certain percentage of the fair market value that is determined by local assessors to be the total taxable value of land and additions on the property. | Land | Improvement |
|---|---|---|---|---|
| 2025 | $4,241 | $654,400 | $140,000 | $514,400 |
| 2023 | $4,306 | $643,400 | $125,000 | $518,400 |
| 2022 | $4,714 | $662,400 | $125,000 | $537,400 |
| 2021 | $3,975 | $458,100 | $95,000 | $363,100 |
| 2020 | $3,766 | $408,800 | $90,000 | $318,800 |
| 2019 | $3,786 | $401,400 | $90,000 | $311,400 |
| 2018 | $3,488 | $347,200 | $0 | $0 |
| 2017 | $3,462 | $334,600 | $0 | $0 |
| 2016 | $3,617 | $323,300 | $0 | $0 |
| 2015 | $3,648 | $312,800 | $0 | $0 |
| 2014 | $3,409 | $294,200 | $0 | $0 |
Source: Public Records
Map
Nearby Homes
- 691 Rainier Dr
- 2024 W 450 Cir S
- 2050 W Canyon View Dr Unit 35b
- 2050 W Canyon View Dr Unit 8A
- 2050 W Canyon View Dr Unit 35B
- 2050 W Canyon View Dr Unit 26
- 2050 W Canyon View Dr Unit 246
- 584 S Dixie Dr Unit Lot 20
- 584 S Dixie Dr Unit Lot 19
- 584 S Dixie Dr
- 584 S Dixie Dr Unit Lot 18
- 584 S Dixie Dr Unit 26
- 0 W 740 S Unit 50 2089047
- 0 W 740 S
- 860 S Village Rd Unit Y-8
- 860 S Village Rd Unit H-8
- 860 S Village Rd Unit G-5
- 860 S Village Rd Unit b-11
- 860 S Village Rd Unit B-5
- 860 S Village Rd Unit I-11
- 622 Rainier Dr
- 1983 Pikes Dr
- 0 Rainier Dr
- Lot 35 Rainier Dr
- lot 40 Rainier Dr
- lot 92 Rainier Dr
- lot 56 Rainier Dr
- lot 101 Rainier Dr
- lot 53 Rainier Dr
- lot 55 Rainier Dr
- lot 105 Rainier Dr
- lot 39 Rainier Dr
- lot 99 Rainier Dr
- lot 38 Rainier Dr
- lot 54 Rainier Dr
- lot 37 Rainier Dr
- lot 98 Rainier Dr
- lot 97 Rainier Dr
- lot 52 Rainier Dr
- lot 96 Rainier Dr