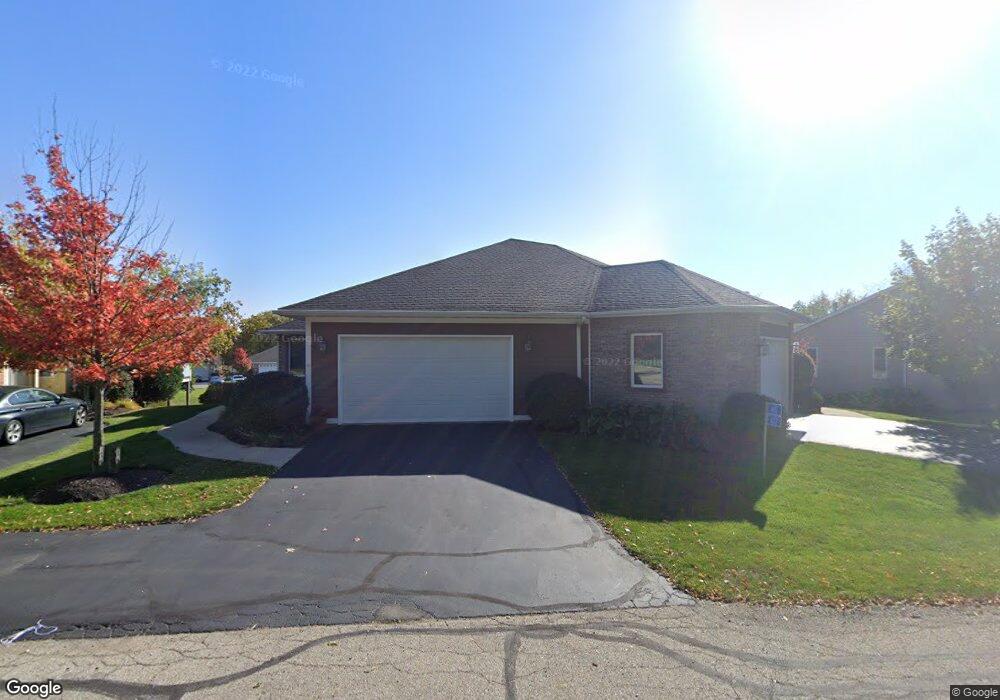
617 Tindalls Nest Twin Lakes, WI 53181
Estimated Value: $345,152 - $441,000
3
Beds
3
Baths
2,242
Sq Ft
$169/Sq Ft
Est. Value
About This Home
This home is located at 617 Tindalls Nest, Twin Lakes, WI 53181 and is currently estimated at $378,538, approximately $168 per square foot. 617 Tindalls Nest is a home located in Kenosha County with nearby schools including Randall Consolidated School and Wilmot High School.
Ownership History
Date
Name
Owned For
Owner Type
Purchase Details
Closed on
Jul 14, 2021
Sold by
Horwath Robert F and Horwath Theresa M
Bought by
Horwath Family Trust
Current Estimated Value
Purchase Details
Closed on
Aug 23, 2016
Sold by
Shepherd Preston D and Shepherd Kristin A
Bought by
Horwath Robert F and Horwath Theresa M
Purchase Details
Closed on
Jan 13, 2016
Sold by
Shepherd Preston D and Shepherd Kristin A
Bought by
Shepherd Preston D and Shepherd Kristin A
Purchase Details
Closed on
Aug 7, 2013
Sold by
Stansbury Jerome J
Bought by
Shepherd Preston D
Purchase Details
Closed on
Jul 11, 2005
Sold by
Tindall Jude Nathaniel and Tindall Jude T
Bought by
Stansbury Jerome J and Stansbury Mary E
Home Financials for this Owner
Home Financials are based on the most recent Mortgage that was taken out on this home.
Original Mortgage
$191,000
Interest Rate
5.5%
Mortgage Type
Adjustable Rate Mortgage/ARM
Purchase Details
Closed on
Jan 8, 2005
Sold by
Tindall Jude Nathaniel
Bought by
Tindall Jude Nathanial and Tindall Jude T
Create a Home Valuation Report for This Property
The Home Valuation Report is an in-depth analysis detailing your home's value as well as a comparison with similar homes in the area
Home Values in the Area
Average Home Value in this Area
Purchase History
| Date | Buyer | Sale Price | Title Company |
|---|---|---|---|
| Horwath Family Trust | -- | None Available | |
| Horwath Robert F | $262,500 | -- | |
| Shepherd Preston D | $239,000 | -- | |
| Shepherd Preston D | $239,000 | -- | |
| Stansbury Jerome J | $239,900 | Professional Title Scus | |
| Tindall Jude Nathanial | -- | Professional Title |
Source: Public Records
Mortgage History
| Date | Status | Borrower | Loan Amount |
|---|---|---|---|
| Previous Owner | Stansbury Jerome J | $191,000 |
Source: Public Records
Tax History Compared to Growth
Tax History
| Year | Tax Paid | Tax Assessment Tax Assessment Total Assessment is a certain percentage of the fair market value that is determined by local assessors to be the total taxable value of land and additions on the property. | Land | Improvement |
|---|---|---|---|---|
| 2024 | $4,510 | $350,500 | $50,000 | $300,500 |
| 2023 | $4,572 | $256,700 | $36,500 | $220,200 |
| 2022 | $4,959 | $256,700 | $36,500 | $220,200 |
| 2021 | $4,950 | $256,700 | $36,500 | $220,200 |
| 2020 | $5,877 | $264,600 | $36,500 | $228,100 |
| 2019 | $5,740 | $264,600 | $36,500 | $228,100 |
| 2018 | $5,521 | $264,600 | $36,500 | $228,100 |
| 2017 | $6,220 | $251,100 | $36,500 | $214,600 |
| 2016 | $6,107 | $251,100 | $36,500 | $214,600 |
| 2015 | $5,415 | $251,100 | $36,500 | $214,600 |
| 2014 | $5,236 | $239,000 | $36,500 | $202,500 |
Source: Public Records
Map
Nearby Homes
- 441 Tindall's Nest
- 610 Tindall's Nest
- 586 Tindall's Nest
- 596 Tindall's Nest
- Lt1 342nd Ave
- 35324 110th St
- 605 Gatewood Dr
- 34308 Bassett Rd
- 517 Oakwood Trail
- 690 Lincoln Dr
- Newport - Two-story Plan at Fairway Woods
- Madison - Two-story Plan at Fairway Woods
- Jefferson - Two-story Plan at Fairway Woods
- Monroe II - Two-story Plan at Fairway Woods
- Truman III - Two-story Plan at Fairway Woods
- Dawson - Two-story Plan at Fairway Woods
- Elway - Ranch Plan at Fairway Woods
- Pasadena II - Ranch Plan at Fairway Woods
- Harrison - Ranch Plan at Fairway Woods
- Adams III - Ranch Plan at Fairway Woods
- 617 Tindalls Nest Unit 112
- 627 Tindalls Nest
- 595 Tindalls Nest
- 639 Tindalls Nest
- 649 Tindalls Nest
- 551 Tindall's Nest
- 551 Tindall's Nest Unit 551
- 561 Tindall's Nest
- 561 Tindall's Nest Unit 561
- 539 Tindall's Nest
- 661 Tindall's Nest
- 1189 Medinah Way
- 517 Tindalls Nest
- 507 Tindalls Nest Unit 507
- 507 Tindalls Nest Unit 507
- 507 Tindalls Nest
- 1182 Medinah Way
- 529 Tindall's Nest
- 495 Tindall's Nest
- 485 Tindall's Nest