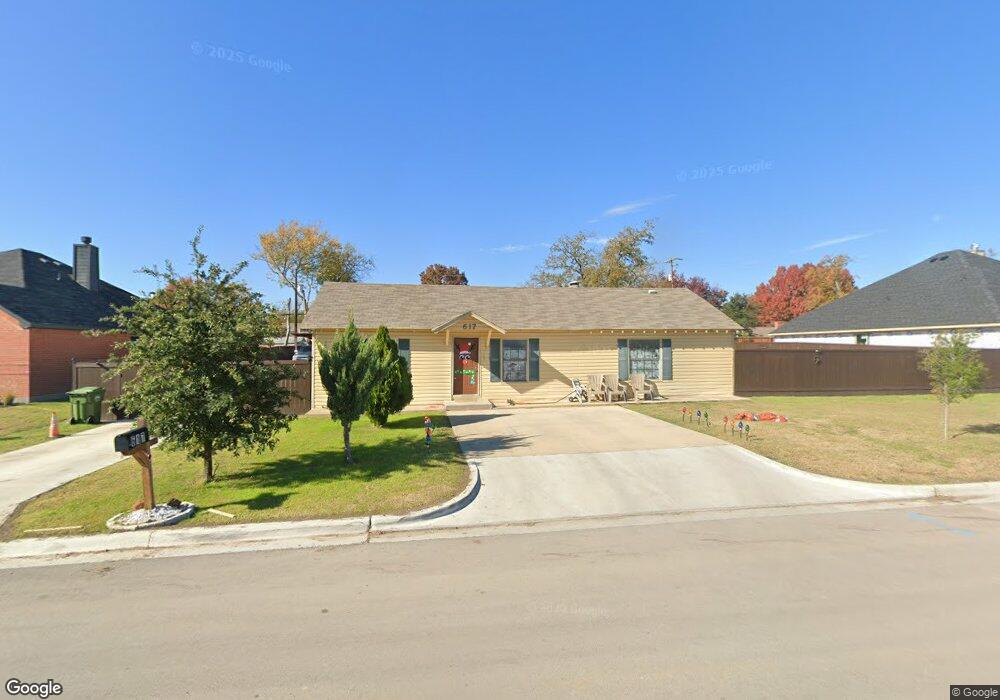
617 Vaquero St Fort Worth, TX 76108
Estimated Value: $222,000 - $248,000
3
Beds
2
Baths
1,276
Sq Ft
$182/Sq Ft
Est. Value
About This Home
This home is located at 617 Vaquero St, Fort Worth, TX 76108 and is currently estimated at $232,836, approximately $182 per square foot. 617 Vaquero St is a home located in Tarrant County with nearby schools including North Elementary School, Brewer Middle School, and Tannahill Intermediate School.
Ownership History
Date
Name
Owned For
Owner Type
Purchase Details
Closed on
Apr 29, 2016
Sold by
T Universal Corp
Bought by
Tovilla Laura P
Current Estimated Value
Home Financials for this Owner
Home Financials are based on the most recent Mortgage that was taken out on this home.
Original Mortgage
$105,245
Outstanding Balance
$83,973
Interest Rate
3.73%
Mortgage Type
New Conventional
Estimated Equity
$148,863
Purchase Details
Closed on
Dec 7, 1999
Sold by
Roye Glenn and Roye Venus
Bought by
T Universal Corp
Purchase Details
Closed on
Dec 14, 1995
Sold by
Rhima Hortencia and Rhima Sam
Bought by
Roye Glenn and Roye Venus
Home Financials for this Owner
Home Financials are based on the most recent Mortgage that was taken out on this home.
Original Mortgage
$26,253
Interest Rate
8.33%
Mortgage Type
Seller Take Back
Create a Home Valuation Report for This Property
The Home Valuation Report is an in-depth analysis detailing your home's value as well as a comparison with similar homes in the area
Home Values in the Area
Average Home Value in this Area
Purchase History
| Date | Buyer | Sale Price | Title Company |
|---|---|---|---|
| Tovilla Laura P | -- | Fwt | |
| T Universal Corp | $45,500 | None Available | |
| Roye Glenn | -- | -- |
Source: Public Records
Mortgage History
| Date | Status | Borrower | Loan Amount |
|---|---|---|---|
| Open | Tovilla Laura P | $105,245 | |
| Previous Owner | Roye Glenn | $26,253 |
Source: Public Records
Tax History Compared to Growth
Tax History
| Year | Tax Paid | Tax Assessment Tax Assessment Total Assessment is a certain percentage of the fair market value that is determined by local assessors to be the total taxable value of land and additions on the property. | Land | Improvement |
|---|---|---|---|---|
| 2025 | $3,232 | $225,027 | $54,449 | $170,578 |
| 2024 | $3,232 | $225,027 | $54,449 | $170,578 |
| 2023 | $4,449 | $226,549 | $54,449 | $172,100 |
| 2022 | $4,607 | $193,182 | $37,500 | $155,682 |
| 2021 | $4,254 | $171,366 | $37,500 | $133,866 |
| 2020 | $3,896 | $151,497 | $37,500 | $113,997 |
| 2019 | $3,677 | $146,919 | $37,500 | $109,419 |
| 2018 | $2,785 | $116,197 | $16,500 | $99,697 |
| 2017 | $3,287 | $112,490 | $16,500 | $95,990 |
| 2016 | $3,518 | $120,386 | $16,500 | $103,886 |
| 2015 | $2,074 | $72,200 | $16,500 | $55,700 |
| 2014 | $2,074 | $72,200 | $16,500 | $55,700 |
Source: Public Records
Map
Nearby Homes
- 633 Lariat Ln
- 8401 Clifford St
- 8133 Foxfire Ln
- 8113 Foxfire Ln
- 813 Hackamore St
- 8814 Rockway St
- 627 Hallvale Dr
- 311 Russell St
- 304 Lockwood St
- 8321 Raymond Ave
- 857 Mccully St
- 308 Hallvale Dr
- 8814 Clifford St
- 8417 Omaha Dr
- 203 East Place
- 914 Ronald St
- 8811 Silver Creek Rd
- 1800 N Las Vegas Trail
- 200 Waynell St
- 8113 Raymond Ave