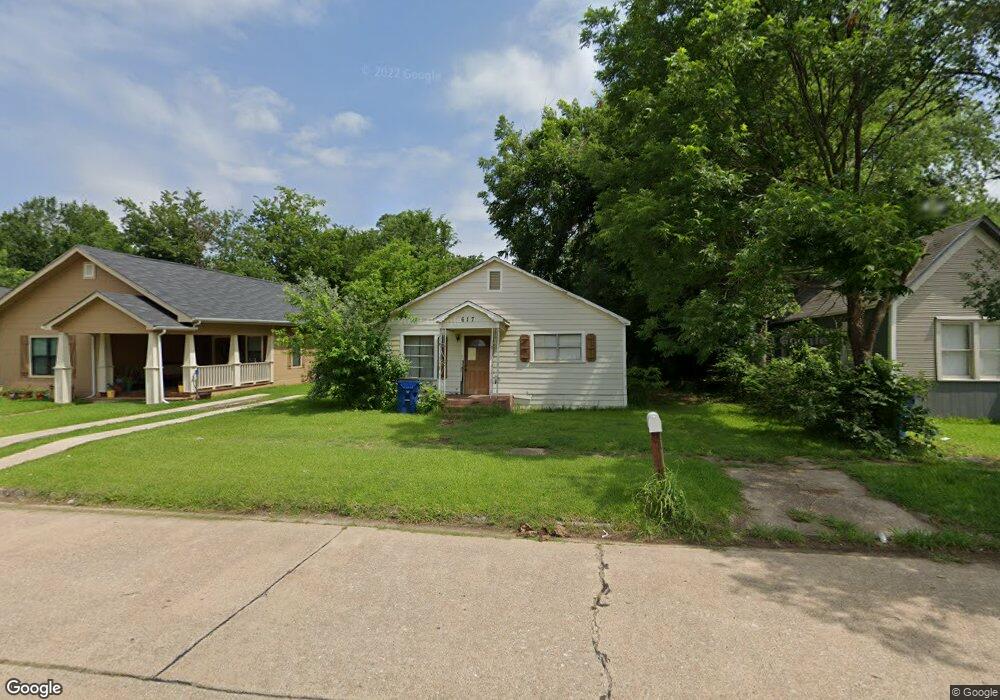
617 W Morgan St Denison, TX 75020
Estimated Value: $140,292 - $198,000
2
Beds
1
Bath
924
Sq Ft
$183/Sq Ft
Est. Value
About This Home
This home is located at 617 W Morgan St, Denison, TX 75020 and is currently estimated at $169,146, approximately $183 per square foot. 617 W Morgan St is a home located in Grayson County with nearby schools including Terrell Elementary School, Scott Middle School, and Denison High School.
Ownership History
Date
Name
Owned For
Owner Type
Purchase Details
Closed on
Oct 22, 2012
Sold by
Fannie Mae
Bought by
Cochran June
Current Estimated Value
Purchase Details
Closed on
Sep 4, 2012
Sold by
Sayani Nazim N and Satani Lee Ann
Bought by
Federal National Mortgage Association and Fannie Mae
Purchase Details
Closed on
May 25, 2010
Sold by
Sayani Nazim Naseeruddin
Bought by
Sayani Lee Ann
Purchase Details
Closed on
Sep 30, 2004
Sold by
Ponder Robert
Bought by
Sayani Nazim N
Home Financials for this Owner
Home Financials are based on the most recent Mortgage that was taken out on this home.
Original Mortgage
$35,445
Interest Rate
5.8%
Mortgage Type
Purchase Money Mortgage
Purchase Details
Closed on
Jan 13, 2004
Sold by
Walker Jamie V
Bought by
Ponder Robert
Create a Home Valuation Report for This Property
The Home Valuation Report is an in-depth analysis detailing your home's value as well as a comparison with similar homes in the area
Home Values in the Area
Average Home Value in this Area
Purchase History
| Date | Buyer | Sale Price | Title Company |
|---|---|---|---|
| Cochran June | -- | Grayson Count Title | |
| Federal National Mortgage Association | $26,250 | None Available | |
| Sayani Lee Ann | -- | None Available | |
| Sayani Nazim N | -- | -- | |
| Ponder Robert | -- | -- |
Source: Public Records
Mortgage History
| Date | Status | Borrower | Loan Amount |
|---|---|---|---|
| Previous Owner | Sayani Nazim N | $35,445 | |
| Closed | Sayani Nazim N | $7,500 | |
| Closed | Sayani Lee Ann | $0 |
Source: Public Records
Tax History Compared to Growth
Tax History
| Year | Tax Paid | Tax Assessment Tax Assessment Total Assessment is a certain percentage of the fair market value that is determined by local assessors to be the total taxable value of land and additions on the property. | Land | Improvement |
|---|---|---|---|---|
| 2025 | $753 | $76,876 | -- | -- |
| 2024 | $1,624 | $69,887 | $0 | $0 |
| 2023 | $651 | $63,534 | $0 | $0 |
| 2022 | $1,847 | $77,748 | $39,000 | $38,748 |
| 2021 | $1,324 | $52,507 | $19,950 | $32,557 |
| 2020 | $1,362 | $51,627 | $15,000 | $36,627 |
| 2019 | $1,273 | $46,270 | $8,550 | $37,720 |
| 2018 | $1,221 | $44,012 | $7,275 | $36,737 |
| 2017 | $1,000 | $35,728 | $3,975 | $31,753 |
| 2016 | $1,040 | $37,184 | $4,500 | $32,684 |
| 2015 | $688 | $24,365 | $3,150 | $21,215 |
| 2014 | $688 | $24,365 | $3,150 | $21,215 |
Source: Public Records
Map
Nearby Homes
- 609 W Owing St
- 705 W Crawford St
- 618 W Chestnut St
- 702 S Barrett Ave
- 627 W Chestnut St
- 831 W Owing St
- 826 W Crawford St
- 330 W Morgan St
- 326-328 W Morgan St
- 830 W Shepherd St
- 920 W Morgan St
- 621 W Munson St
- 904 W Shepherd St
- TBD W Main St
- 506 W Woodard St
- 511 W Munson St
- 408 W Day St
- 919 W Day St
- 811 W Woodard St
- 901 W Munson St
- 613 W Morgan St
- 623 W Morgan St
- 611 W Morgan St
- 627 W Morgan St
- 605 W Morgan St
- 618 W Owing St
- 631 W Morgan St
- 618 W Owings St
- 614 W Owing St
- 622 W Owing St
- 610 W Owing St
- 610 W Owings St
- 604 W Owings St
- 604 W Owing St
- 630 W Owing St Unit 2
- 630 W Owing St Unit 1
- 630 W Owing St
- 630 W Owing St
- 618 W Morgan St
- 624 W Morgan St