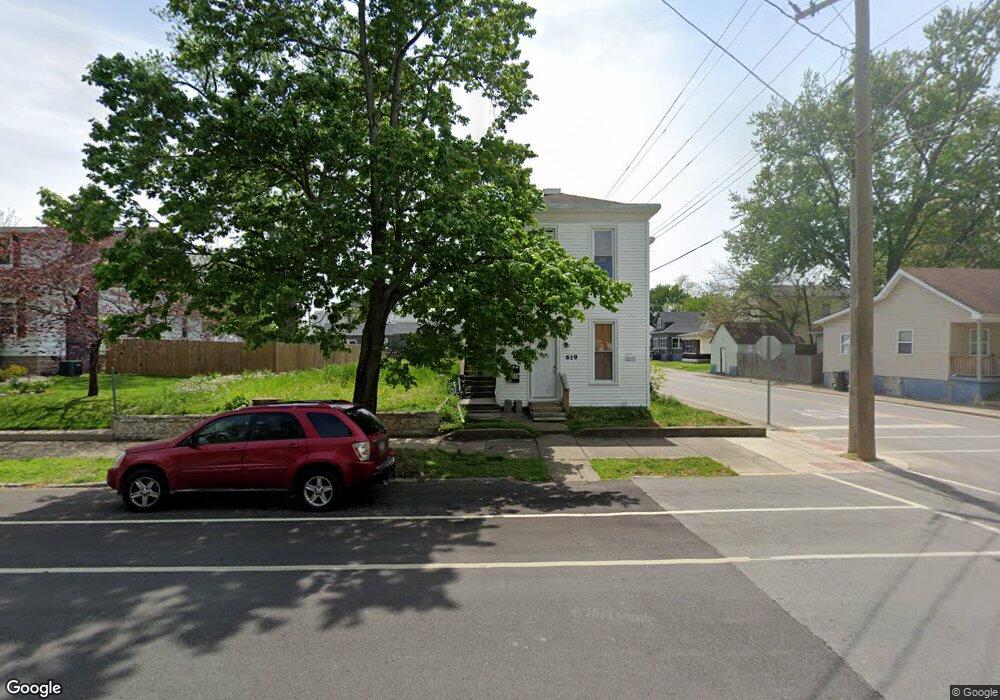
617 W Spring St New Albany, IN 47150
Estimated Value: $79,000 - $222,000
2
Beds
1
Bath
1,390
Sq Ft
$105/Sq Ft
Est. Value
About This Home
This home is located at 617 W Spring St, New Albany, IN 47150 and is currently estimated at $146,209, approximately $105 per square foot. 617 W Spring St is a home located in Floyd County with nearby schools including S. Ellen Jones Elementary School, Nathaniel Scribner Middle School, and New Albany Senior High School.
Ownership History
Date
Name
Owned For
Owner Type
Purchase Details
Closed on
Sep 24, 2024
Sold by
Ancient Land Investments Llc
Bought by
Tcc Property Holdings Llc
Current Estimated Value
Purchase Details
Closed on
Oct 7, 2021
Sold by
Tran Hanh
Bought by
Ancient Land Investment Llc
Purchase Details
Closed on
Sep 15, 2020
Sold by
Nguyen Huong
Bought by
Tran Hanh
Purchase Details
Closed on
Jun 11, 2018
Sold by
Bisinger Joe
Bought by
Nguyen Huong
Purchase Details
Closed on
Nov 29, 2013
Sold by
Floyd County Sheriff
Bought by
Your Community Bank
Purchase Details
Closed on
Nov 14, 2013
Sold by
Mills Darrell
Bought by
Bisinger Joe
Purchase Details
Closed on
Aug 15, 2007
Sold by
Shackelford Howard K
Bought by
Castile Bill
Home Financials for this Owner
Home Financials are based on the most recent Mortgage that was taken out on this home.
Original Mortgage
$45,000
Interest Rate
6.79%
Mortgage Type
Purchase Money Mortgage
Create a Home Valuation Report for This Property
The Home Valuation Report is an in-depth analysis detailing your home's value as well as a comparison with similar homes in the area
Home Values in the Area
Average Home Value in this Area
Purchase History
| Date | Buyer | Sale Price | Title Company |
|---|---|---|---|
| Tcc Property Holdings Llc | $100,000 | None Listed On Document | |
| Ancient Land Investment Llc | -- | None Listed On Document | |
| Tran Hanh | -- | None Available | |
| Nguyen Huong | -- | Signature Title Llc | |
| Your Community Bank | $64,646 | -- | |
| Bisinger Joe | $600 | -- | |
| Castile Bill | -- | None Available |
Source: Public Records
Mortgage History
| Date | Status | Borrower | Loan Amount |
|---|---|---|---|
| Previous Owner | Castile Bill | $45,000 |
Source: Public Records
Tax History Compared to Growth
Tax History
| Year | Tax Paid | Tax Assessment Tax Assessment Total Assessment is a certain percentage of the fair market value that is determined by local assessors to be the total taxable value of land and additions on the property. | Land | Improvement |
|---|---|---|---|---|
| 2024 | $240 | $11,300 | $11,300 | $0 |
| 2023 | $537 | $11,300 | $11,300 | $0 |
| 2022 | $401 | $18,500 | $11,300 | $7,200 |
| 2021 | $391 | $17,900 | $11,300 | $6,600 |
| 2020 | $391 | $17,900 | $11,300 | $6,600 |
| 2019 | $376 | $17,200 | $11,300 | $5,900 |
| 2018 | $376 | $17,100 | $11,300 | $5,800 |
| 2017 | $569 | $17,100 | $11,300 | $5,800 |
| 2016 | $340 | $17,000 | $11,300 | $5,700 |
| 2014 | $918 | $45,900 | $11,200 | $34,700 |
| 2013 | -- | $44,900 | $11,300 | $33,600 |
Source: Public Records
Map
Nearby Homes
- 613 W Market St
- 605 W 6th St
- 220 W 8th St
- 219 W 8th St
- 229 W 9th St
- 655 W 7th St
- 219 W 9th St
- 1002 W Main St
- 628 W 9th St
- 5102 Woodstone Circle Lot#161
- 109 Nighthawk Place
- 115 Nighthawk Place
- 5153 Woodstone Circle Lot 135
- 113 Nighthawk Place
- 117 Nighthawk Place
- 911 Cherry St
- 1414 Knob Ave
- 917 Valley View Rd
- 929 Valley View Rd
- 1107 Griffin St