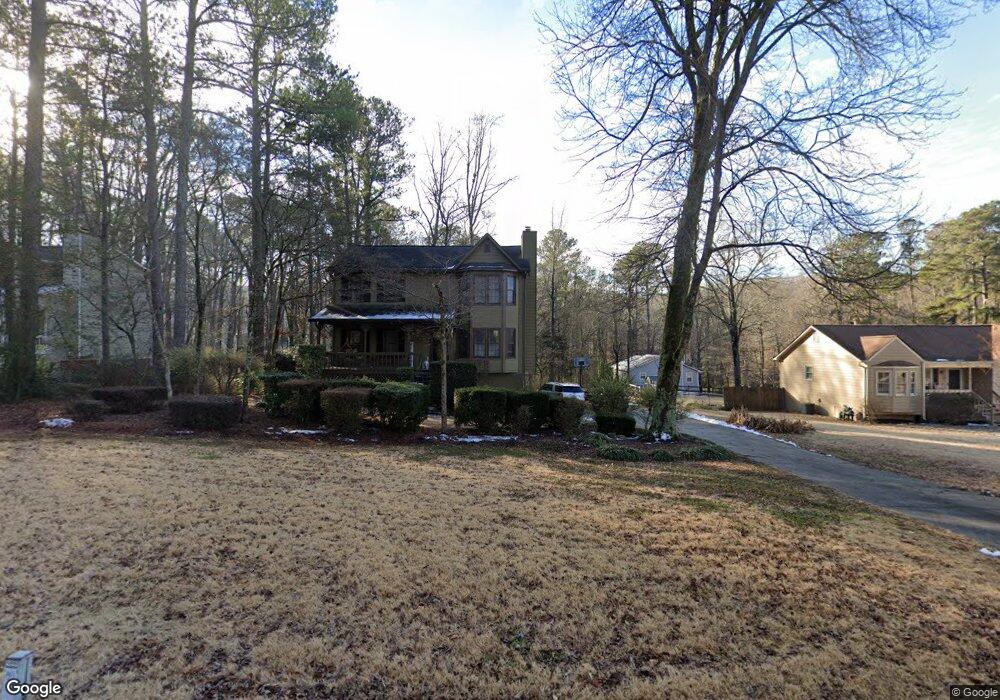
6171 Picketts Ridge NW Unit 2 Acworth, GA 30101
Estimated Value: $345,435 - $411,000
3
Beds
2
Baths
1,800
Sq Ft
$208/Sq Ft
Est. Value
About This Home
This home is located at 6171 Picketts Ridge NW Unit 2, Acworth, GA 30101 and is currently estimated at $374,109, approximately $207 per square foot. 6171 Picketts Ridge NW Unit 2 is a home located in Cobb County with nearby schools including Pickett's Mill Elementary School, Durham Middle School, and Allatoona High School.
Ownership History
Date
Name
Owned For
Owner Type
Purchase Details
Closed on
Jun 23, 2016
Sold by
Peter L
Bought by
Purvis Peter L and Purvis Louisa B
Current Estimated Value
Home Financials for this Owner
Home Financials are based on the most recent Mortgage that was taken out on this home.
Original Mortgage
$65,000
Outstanding Balance
$40,694
Interest Rate
3.64%
Mortgage Type
New Conventional
Estimated Equity
$333,415
Purchase Details
Closed on
Jun 18, 1999
Sold by
Elliott Terry A and Elliott Sandra C
Bought by
Purvis Peter L
Home Financials for this Owner
Home Financials are based on the most recent Mortgage that was taken out on this home.
Original Mortgage
$119,700
Interest Rate
7.13%
Mortgage Type
New Conventional
Create a Home Valuation Report for This Property
The Home Valuation Report is an in-depth analysis detailing your home's value as well as a comparison with similar homes in the area
Home Values in the Area
Average Home Value in this Area
Purchase History
| Date | Buyer | Sale Price | Title Company |
|---|---|---|---|
| Purvis Peter L | -- | -- | |
| Purvis Peter L | $126,000 | -- |
Source: Public Records
Mortgage History
| Date | Status | Borrower | Loan Amount |
|---|---|---|---|
| Open | Purvis Peter L | $65,000 | |
| Previous Owner | Purvis Peter L | $119,700 |
Source: Public Records
Tax History Compared to Growth
Tax History
| Year | Tax Paid | Tax Assessment Tax Assessment Total Assessment is a certain percentage of the fair market value that is determined by local assessors to be the total taxable value of land and additions on the property. | Land | Improvement |
|---|---|---|---|---|
| 2025 | $3,417 | $154,624 | $32,000 | $122,624 |
| 2024 | $3,972 | $180,080 | $32,000 | $148,080 |
| 2023 | $2,197 | $123,264 | $18,000 | $105,264 |
| 2022 | $2,453 | $109,136 | $18,000 | $91,136 |
| 2021 | $2,019 | $89,296 | $18,000 | $71,296 |
| 2020 | $2,019 | $89,296 | $18,000 | $71,296 |
| 2019 | $1,455 | $63,540 | $18,000 | $45,540 |
| 2018 | $1,455 | $63,540 | $18,000 | $45,540 |
| 2017 | $1,800 | $62,591 | $16,000 | $46,591 |
| 2016 | $1,288 | $57,848 | $16,000 | $41,848 |
| 2015 | $1,316 | $57,848 | $16,000 | $41,848 |
| 2014 | $924 | $39,952 | $0 | $0 |
Source: Public Records
Map
Nearby Homes
- 3465 Plantation Ridge NW
- 3684 Autumn View Dr NW
- 427 Picketts Lake Dr
- 6214 Treeridge Dr NW
- 3802 Bayside Passage NW Unit 1
- 90 Old Stilesboro Rd NW
- 6412 Old Stilesboro Rd NW
- 3917 Dallas Acworth Hwy NW
- The Everleigh Plan at Madeira
- 6351 Granbury Walk NW
- 39 Telfair Ct
- 64 Telfair Ct
- 254 Broadstone Blvd
- 5851 Bridgemont Place NW
- 107 Stonewood Creek Dr
- 1302 Cedarcrest Blvd
- 138 Highcrest Dr
- 6169 Picketts Ridge NW Unit 2
- 3458 Trooper Ridge NW
- 6167 Picketts Ridge NW
- 3456 Trooper Ridge NW
- 6174 Picketts Ridge NW
- 6172 Picketts Ridge NW Unit 2
- 6170 Picketts Ridge NW
- 6174 Picketts Nw NW
- 3452 Trooper Ridge NW
- 6176 Picketts Ridge NW
- 0 Trooper Ridge Rd Unit 7377909
- 3459 Trooper Ridge NW
- 6168 Picketts Ridge NW
- 3457 Trooper Ridge NW
- 3454 Trooper Ridge NW
- 6178 Picketts Ridge NW
- 6163 Picketts Ridge NW
- 6166 Picketts Ridge NW
- 3455 Trooper Ridge NW Unit 2