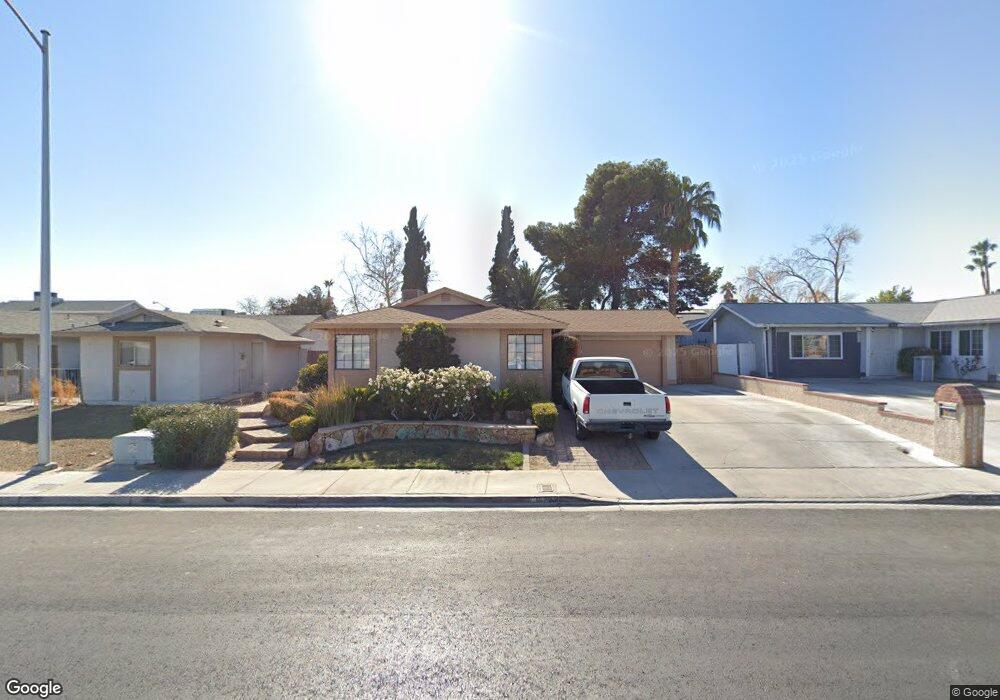
6173 Foothill Blvd Las Vegas, NV 89118
Estimated Value: $336,000 - $397,000
3
Beds
2
Baths
1,100
Sq Ft
$331/Sq Ft
Est. Value
About This Home
This home is located at 6173 Foothill Blvd, Las Vegas, NV 89118 and is currently estimated at $364,229, approximately $331 per square foot. 6173 Foothill Blvd is a home located in Clark County with nearby schools including Marion B Earl Elementary School, Grant Sawyer Middle School, and Durango High School.
Ownership History
Date
Name
Owned For
Owner Type
Purchase Details
Closed on
Jun 30, 2018
Sold by
Enriquez Ruben
Bought by
Fuentes Joaquin E
Current Estimated Value
Purchase Details
Closed on
Nov 28, 1994
Sold by
Fuentes Hilda
Bought by
Fuentes Joaquin E
Home Financials for this Owner
Home Financials are based on the most recent Mortgage that was taken out on this home.
Original Mortgage
$91,207
Interest Rate
8.9%
Mortgage Type
FHA
Purchase Details
Closed on
Nov 21, 1994
Sold by
Hud
Bought by
Fuentes Joaquin E and Enriquez Ruben
Home Financials for this Owner
Home Financials are based on the most recent Mortgage that was taken out on this home.
Original Mortgage
$91,207
Interest Rate
8.9%
Mortgage Type
FHA
Purchase Details
Closed on
Aug 18, 1994
Sold by
Chemical Mtg Company
Bought by
Hud
Purchase Details
Closed on
Jan 26, 1994
Sold by
Cal Western Reconveyance Corp
Bought by
Chemical Mtg Company
Create a Home Valuation Report for This Property
The Home Valuation Report is an in-depth analysis detailing your home's value as well as a comparison with similar homes in the area
Home Values in the Area
Average Home Value in this Area
Purchase History
| Date | Buyer | Sale Price | Title Company |
|---|---|---|---|
| Fuentes Joaquin E | -- | Accommodation | |
| Enriquez Ruben | -- | Accommodation | |
| Fuentes Joaquin E | -- | Land Title | |
| Fuentes Joaquin E | -- | Land Title | |
| Hud | -- | First American Title Company | |
| Chemical Mtg Company | $93,500 | First American Title Company |
Source: Public Records
Mortgage History
| Date | Status | Borrower | Loan Amount |
|---|---|---|---|
| Previous Owner | Fuentes Joaquin E | $91,207 |
Source: Public Records
Tax History Compared to Growth
Tax History
| Year | Tax Paid | Tax Assessment Tax Assessment Total Assessment is a certain percentage of the fair market value that is determined by local assessors to be the total taxable value of land and additions on the property. | Land | Improvement |
|---|---|---|---|---|
| 2025 | $1,250 | $52,304 | $34,020 | $18,284 |
| 2024 | $1,158 | $52,304 | $34,020 | $18,284 |
| 2023 | $771 | $49,873 | $31,500 | $18,373 |
| 2022 | $1,073 | $43,941 | $26,775 | $17,166 |
| 2021 | $993 | $39,415 | $22,680 | $16,735 |
| 2020 | $919 | $39,682 | $22,680 | $17,002 |
| 2019 | $862 | $35,976 | $18,900 | $17,076 |
| 2018 | $822 | $35,597 | $18,900 | $16,697 |
| 2017 | $1,038 | $35,376 | $18,200 | $17,176 |
| 2016 | $771 | $30,512 | $12,600 | $17,912 |
| 2015 | $768 | $30,232 | $12,250 | $17,982 |
| 2014 | $744 | $25,706 | $8,750 | $16,956 |
Source: Public Records
Map
Nearby Homes
- 6358 Elmira Dr
- 5166 S Jones Blvd Unit 205
- 5166 S Jones Blvd Unit 101
- 5000 Red Rock St Unit 202
- 5000 Red Rock St Unit 165
- 5000 Red Rock St Unit 105
- 5000 Red Rock St Unit 248
- 5000 Red Rock St Unit 240
- 5000 Red Rock St Unit 241
- 5000 Red Rock St Unit 237
- 5000 Red Rock St Unit 211
- 5158 S Jones Blvd Unit 208
- 5158 S Jones Blvd Unit 201
- 5958 Greenery View Ln
- 5195 Sepulveda Blvd
- 6428 Crystal Dew Dr
- 5130 S Jones Blvd Unit 102
- 5240 Island Chain Rd
- 6420 Aclare Ave
- 6362 Gessler Ct
- 6181 Foothill Blvd
- 6163 Foothill Blvd
- 6172 Katella Ave
- 6184 Katella Ave
- 6189 Foothill Blvd
- 6153 Foothill Blvd
- 6160 Katella Ave
- 6174 Foothill Blvd
- 6194 Katella Ave
- 6164 Foothill Blvd
- 6164 W Foothill Blvd
- 6182 Foothill Blvd
- 6197 Foothill Blvd
- 6145 Foothill Blvd
- 6197 W Foothill Blvd
- 6154 Foothill Blvd
- 6150 Katella Ave
- 6194 Foothill Blvd
- 6146 W Foothill Blvd
- 6204 Katella Ave