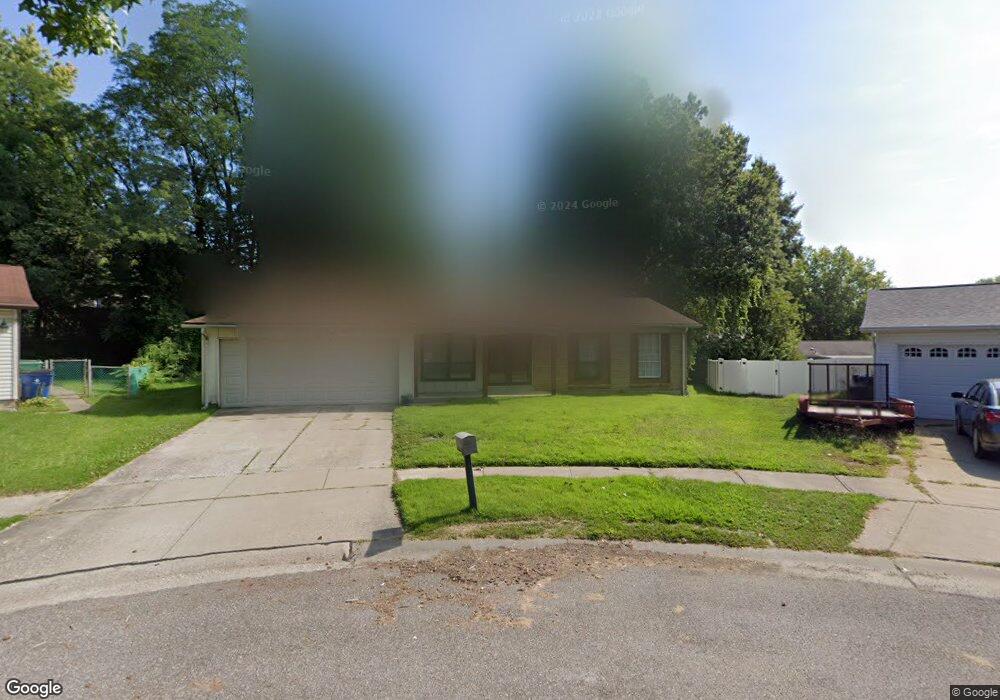
6175 Red Wagon Ct Florissant, MO 63033
Estimated Value: $178,760 - $202,000
3
Beds
2
Baths
1,205
Sq Ft
$158/Sq Ft
Est. Value
About This Home
This home is located at 6175 Red Wagon Ct, Florissant, MO 63033 and is currently estimated at $190,690, approximately $158 per square foot. 6175 Red Wagon Ct is a home located in St. Louis County with nearby schools including Townsend Elementary School, Central Middle School, and Hazelwood Central High School.
Ownership History
Date
Name
Owned For
Owner Type
Purchase Details
Closed on
Jul 27, 2015
Sold by
Dela Cruz Batista Henry and De La Cruz Christina R
Bought by
Delacruz Batista Henry and Delacruz Christina
Current Estimated Value
Home Financials for this Owner
Home Financials are based on the most recent Mortgage that was taken out on this home.
Original Mortgage
$83,892
Interest Rate
4.75%
Mortgage Type
FHA
Purchase Details
Closed on
Mar 25, 2013
Sold by
Frederiksen Keith A and Grellner Mark R
Bought by
Batista Henry Delacruz and Delacruz Christina R
Purchase Details
Closed on
Jul 27, 1999
Sold by
Frederiksen Christophew M and Frederiksen Rosalie M
Bought by
Frederiksen Christina R and Frederiksen Michelle M
Create a Home Valuation Report for This Property
The Home Valuation Report is an in-depth analysis detailing your home's value as well as a comparison with similar homes in the area
Home Values in the Area
Average Home Value in this Area
Purchase History
| Date | Buyer | Sale Price | Title Company |
|---|---|---|---|
| Delacruz Batista Henry | -- | Chesterfield Title Agency Ll | |
| Batista Henry Delacruz | -- | Investors Title Co Clayton | |
| Batista Henry Delacruz | -- | Investors Title Co Clayton | |
| Frederiksen Christina R | -- | -- |
Source: Public Records
Mortgage History
| Date | Status | Borrower | Loan Amount |
|---|---|---|---|
| Closed | Delacruz Batista Henry | $83,892 |
Source: Public Records
Tax History Compared to Growth
Tax History
| Year | Tax Paid | Tax Assessment Tax Assessment Total Assessment is a certain percentage of the fair market value that is determined by local assessors to be the total taxable value of land and additions on the property. | Land | Improvement |
|---|---|---|---|---|
| 2025 | $2,216 | $31,240 | $3,800 | $27,440 |
| 2024 | $2,216 | $24,450 | $2,640 | $21,810 |
| 2023 | $2,216 | $24,450 | $2,640 | $21,810 |
| 2022 | $2,201 | $21,680 | $4,960 | $16,720 |
| 2021 | $2,083 | $21,680 | $4,960 | $16,720 |
| 2020 | $2,053 | $19,910 | $2,980 | $16,930 |
| 2019 | $2,037 | $19,910 | $2,980 | $16,930 |
| 2018 | $1,741 | $15,700 | $1,750 | $13,950 |
| 2017 | $1,739 | $15,700 | $1,750 | $13,950 |
| 2016 | $1,960 | $17,440 | $2,510 | $14,930 |
| 2015 | $1,916 | $17,440 | $2,510 | $14,930 |
| 2014 | $1,980 | $17,960 | $3,040 | $14,920 |
Source: Public Records
Map
Nearby Homes
- 12136 La Padera Ln
- 6250 Pennyrich Ct
- 12095 El Camara Dr
- 12065 El Camara Dr
- 12320 Missile Ln
- 11922 La Padera Ln
- 11760 Sheffield Dr
- 12292 Jerries Ln
- 6530 Farm Pond Ct
- 11774 El Somo Ct
- 6480 Hadden Bay Dr
- 11951 Jerries Ln
- 6320 Hadden Bay Dr
- 5432 Trailbend Dr
- 12455 Jerries Ln
- 5348 Trailoaks Dr
- 5372 Trailbend Dr
- 6587 Dolphin Cir E Unit 110B
- 6595 Dolphin Cir E Unit 131A
- 11757 Vizcuya Ct
- 6155 Red Wagon Ct
- 12147 La Padera Ln
- 6174 Red Wagon Ct
- 6160 Pennyrich Ct
- 6140 Pennyrich Ct
- 6135 Red Wagon Ct
- 6180 Pennyrich Ct
- 6154 Red Wagon Ct
- 6120 Pennyrich Ct
- 12127 La Padera Ln
- 6124 Red Wagon Ct
- 12128 El Camara Dr
- 12158 El Camara Dr
- 12117 La Padera Ln
- 12168 El Camara Dr
- 6200 Pennyrich Ct
- 12126 La Padera Ln
- 6100 Pennyrich Ct
- 12118 El Camara Dr
- 6185 Pennyrich Ct