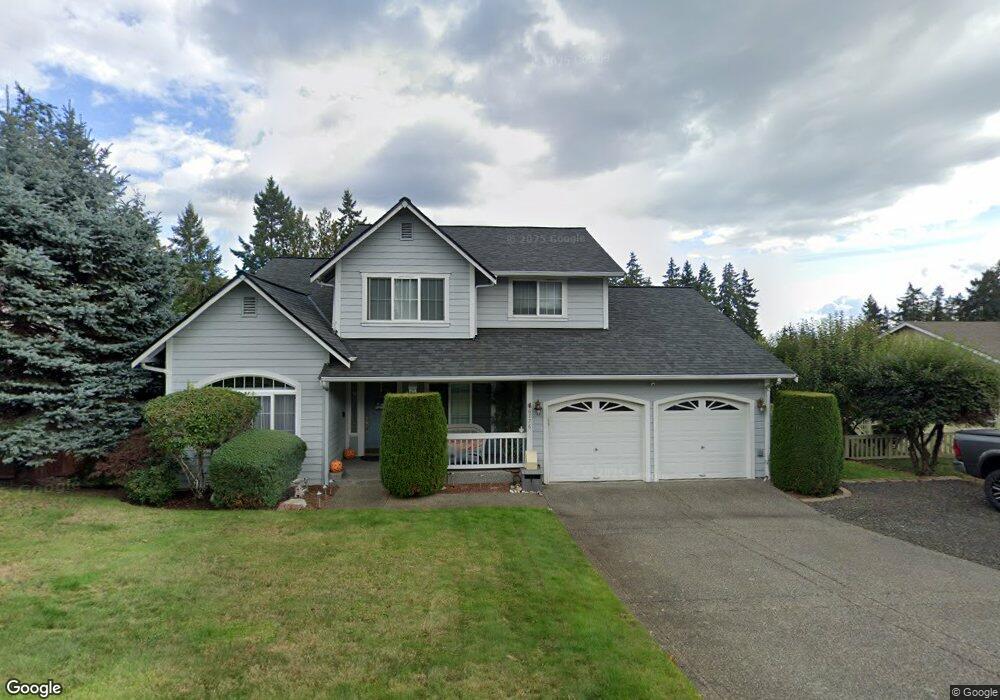
6176 Oceanside Place NE Bremerton, WA 98311
Estimated Value: $533,511 - $622,000
3
Beds
3
Baths
2,040
Sq Ft
$288/Sq Ft
Est. Value
About This Home
This home is located at 6176 Oceanside Place NE, Bremerton, WA 98311 and is currently estimated at $588,128, approximately $288 per square foot. 6176 Oceanside Place NE is a home located in Kitsap County with nearby schools including View Ridge Elementary School, Mountain View Middle School, and Bremerton High School.
Ownership History
Date
Name
Owned For
Owner Type
Purchase Details
Closed on
Dec 9, 1998
Sold by
Cook Construction Inc
Bought by
Jose Oscar C and Jose Prescila L
Current Estimated Value
Home Financials for this Owner
Home Financials are based on the most recent Mortgage that was taken out on this home.
Original Mortgage
$176,500
Outstanding Balance
$40,092
Interest Rate
6.78%
Mortgage Type
VA
Estimated Equity
$548,036
Purchase Details
Closed on
Aug 18, 1998
Sold by
Illahee North Associates
Bought by
Cook Construction Inc
Home Financials for this Owner
Home Financials are based on the most recent Mortgage that was taken out on this home.
Original Mortgage
$138,456
Interest Rate
6.88%
Mortgage Type
Construction
Create a Home Valuation Report for This Property
The Home Valuation Report is an in-depth analysis detailing your home's value as well as a comparison with similar homes in the area
Home Values in the Area
Average Home Value in this Area
Purchase History
| Date | Buyer | Sale Price | Title Company |
|---|---|---|---|
| Jose Oscar C | $173,070 | Land Title Company | |
| Cook Construction Inc | $27,500 | Land Title Company |
Source: Public Records
Mortgage History
| Date | Status | Borrower | Loan Amount |
|---|---|---|---|
| Open | Jose Oscar C | $176,500 | |
| Previous Owner | Cook Construction Inc | $138,456 |
Source: Public Records
Tax History Compared to Growth
Tax History
| Year | Tax Paid | Tax Assessment Tax Assessment Total Assessment is a certain percentage of the fair market value that is determined by local assessors to be the total taxable value of land and additions on the property. | Land | Improvement |
|---|---|---|---|---|
| 2026 | $5,037 | $511,900 | $107,320 | $404,580 |
| 2025 | $5,037 | $511,900 | $107,320 | $404,580 |
| 2024 | $4,865 | $511,900 | $107,320 | $404,580 |
| 2023 | $4,880 | $511,900 | $107,320 | $404,580 |
| 2022 | $4,574 | $424,400 | $88,690 | $335,710 |
| 2021 | $4,311 | $375,380 | $62,290 | $313,090 |
| 2020 | $3,943 | $354,670 | $58,780 | $295,890 |
| 2019 | $3,766 | $336,540 | $55,870 | $280,670 |
| 2018 | $4,149 | $291,440 | $46,170 | $245,270 |
| 2017 | $3,908 | $291,440 | $46,170 | $245,270 |
| 2016 | $3,699 | $261,790 | $41,230 | $220,560 |
| 2015 | $3,373 | $244,150 | $45,670 | $198,480 |
| 2014 | -- | $232,270 | $45,670 | $186,600 |
| 2013 | -- | $232,270 | $45,670 | $186,600 |
Source: Public Records
Map
Nearby Homes
- 3532 NE Shore Cliff St
- 6305 Rest Place NE
- 3840 NE Ambleside Ln
- 3 Illahee Rd NE
- 3744 NE Trout Brook Ln
- 5503 Fern Ave NE
- 3703 NE Trout Brook Ln
- 3709 NE Liverpool Dr
- 5208 Illahee Rd NE
- 3060 NE Mcwilliams Rd Unit 104
- 3060 NE Mcwilliams Rd Unit 9
- 3060 NE Mcwilliams Rd Unit 124
- 2940 Osiris Ct NE
- 0 University Point Cir NE
- 7550 Varsity Ln NE
- 6371 Illahee Rd NE
- 7265 Thasos Ave NE
- 2348 NE Windsor Ct
- 3000 NE Loyola St
- 3467 Partridge Hollow NE
- 6182 Oceanside Place NE
- 6170 Oceanside Place NE
- 6181 Oceanside Place NE
- 6187 Oceanside Place NE
- 7289 NE Creekwood
- 6164 Oceanside Place NE
- 6188 Oceanside Place NE
- 6193 Oceanside Place NE
- 3551 NE Shore Cliff St
- 6169 Oceanside Place NE
- 3545 NE Shore Cliff St
- 6194 Oceanside Place NE
- 6106 Illahee Unit 16
- 6106 Illahee Rd NE
- 3539 NE Shore Cliff St
- 6163 Oceanside Place NE
- 6056 Illahee Rd NE
- 6226 Illahee Rd NE