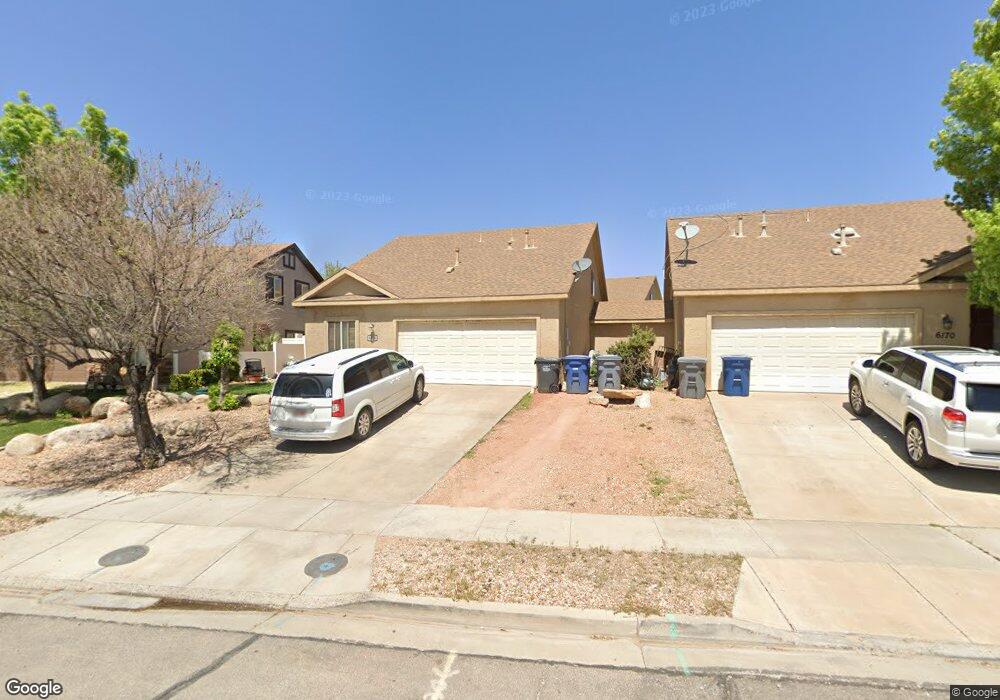
6178 W 200 S Hurricane, UT 84737
Estimated Value: $375,000 - $476,000
4
Beds
3
Baths
1,725
Sq Ft
$238/Sq Ft
Est. Value
About This Home
This home is located at 6178 W 200 S, Hurricane, UT 84737 and is currently estimated at $410,734, approximately $238 per square foot. 6178 W 200 S is a home located in Washington County with nearby schools including Coral Canyon School, Pine View Middle School, and Fossil Ridge Intermediate School.
Ownership History
Date
Name
Owned For
Owner Type
Purchase Details
Closed on
Apr 7, 2020
Sold by
Dicus Albert L
Bought by
Dicus Albert L
Current Estimated Value
Home Financials for this Owner
Home Financials are based on the most recent Mortgage that was taken out on this home.
Original Mortgage
$182,000
Outstanding Balance
$161,230
Interest Rate
3.4%
Mortgage Type
New Conventional
Estimated Equity
$249,504
Purchase Details
Closed on
Jan 6, 2010
Sold by
Federal Home Loan Mortgage Corporation
Bought by
Adams Brant Kade
Purchase Details
Closed on
Jul 30, 2009
Sold by
Cheney Jonathan H and Cheney Kimberly Fivas
Bought by
Federal Home Loan Mortgage Corp
Purchase Details
Closed on
Oct 24, 2005
Sold by
Cheney Financial Services Inc
Bought by
Cheney Jonathan H and Cheney Kimberly Fivas
Home Financials for this Owner
Home Financials are based on the most recent Mortgage that was taken out on this home.
Original Mortgage
$115,900
Interest Rate
5.74%
Mortgage Type
New Conventional
Create a Home Valuation Report for This Property
The Home Valuation Report is an in-depth analysis detailing your home's value as well as a comparison with similar homes in the area
Home Values in the Area
Average Home Value in this Area
Purchase History
| Date | Buyer | Sale Price | Title Company |
|---|---|---|---|
| Dicus Albert L | -- | Inwest Title Svcs St George | |
| Adams Brant Kade | -- | Bonneville Superior Title Co | |
| Federal Home Loan Mortgage Corp | $117,949 | Etitle Insurance Agency | |
| Cheney Jonathan H | -- | Southern Utah Title Co |
Source: Public Records
Mortgage History
| Date | Status | Borrower | Loan Amount |
|---|---|---|---|
| Open | Dicus Albert L | $182,000 | |
| Previous Owner | Cheney Jonathan H | $115,900 | |
| Closed | Adams Brant Kade | $0 |
Source: Public Records
Tax History Compared to Growth
Tax History
| Year | Tax Paid | Tax Assessment Tax Assessment Total Assessment is a certain percentage of the fair market value that is determined by local assessors to be the total taxable value of land and additions on the property. | Land | Improvement |
|---|---|---|---|---|
| 2025 | $1,398 | $196,240 | $48,400 | $147,840 |
| 2023 | $1,509 | $202,400 | $42,350 | $160,050 |
| 2022 | $1,611 | $202,565 | $42,350 | $160,215 |
| 2021 | $1,405 | $261,200 | $55,000 | $206,200 |
| 2020 | $1,354 | $235,200 | $55,000 | $180,200 |
| 2019 | $2,150 | $199,300 | $55,000 | $144,300 |
| 2018 | $2,044 | $177,200 | $0 | $0 |
| 2017 | $1,967 | $164,000 | $0 | $0 |
| 2016 | $1,776 | $143,400 | $0 | $0 |
| 2015 | $964 | $74,965 | $0 | $0 |
| 2014 | $817 | $66,110 | $0 | $0 |
Source: Public Records
Map
Nearby Homes
- 2020 N Pebble Beach Dr
- 2018 N Pebble Beach Dr
- 182 W Elinor Ln
- 6222 W 135 N Unit 16
- 6159 Winding Way Unit M106
- 2094 N Coral Ridge Dr
- 2041 N Pebble Beach Dr
- 4205 Torrey Pines Dr
- 228 Lone Rock Dr Unit 201
- 228 Lone Rock Dr Unit 205
- 228 Lone Rock Dr Unit 102
- 228 Lone Rock Dr Unit 202
- 228 Lone Rock Dr Unit 403
- 228 Lone Rock Dr Unit 301
- 228 Lone Rock Dr
- 2076 N Doral Ct
- 224 N Chapparral Unit M201
- 226 N Cliff Side Dr Unit L-300
- 226 N Cliff Side Dr Unit L-105
- 226 N Cliff Side Dr Unit K200
- 6170 W 200 S
- 6186 W 200 S
- 6194 W 200 S
- 6183 W 100 S
- 6183 W 100 S Unit 33
- 6160 W 200 S
- 6160 W 200 S Unit 19
- 6179 W 100 S
- 6179 W 100 S Unit 34
- 6169 W 100 S
- 6169 W 100 S Unit 35
- 6195 W 100 S
- 6195 W 100 S Unit 32
- 6218 W 200 S
- 6218 W 200 S Unit 24
- 168 S 6150 W
- 6183 W 200 S Unit 13
- 6161 W 200 S
- 6161 W 200 S Unit 15
- 6191 W 200 S