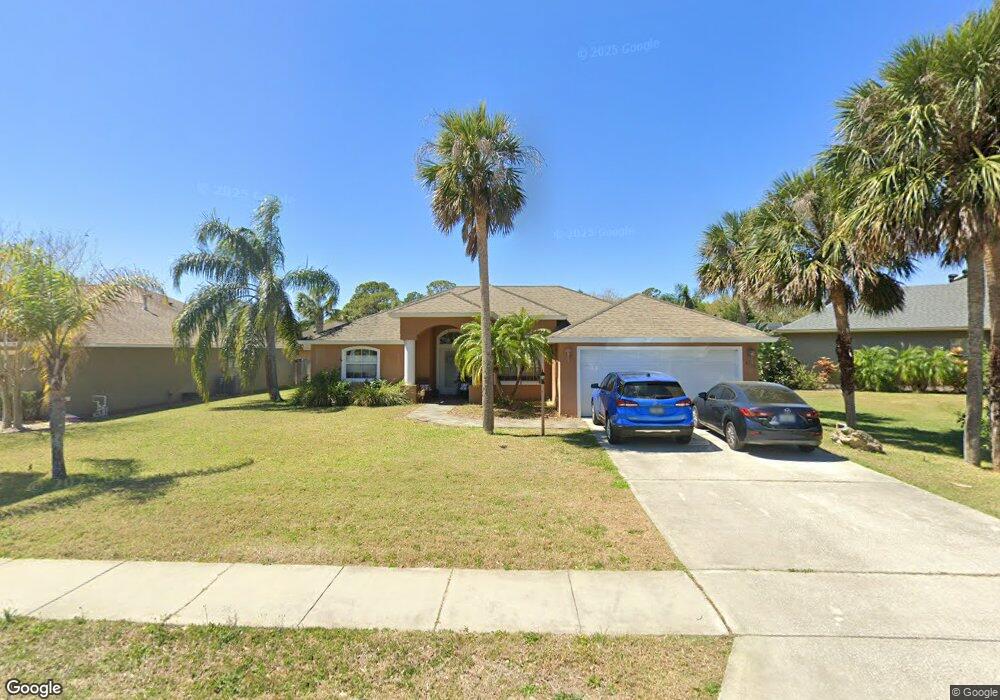
6179 Knotty Pine Ct Port Orange, FL 32127
South Port Orange NeighborhoodEstimated Value: $407,255 - $455,000
3
Beds
2
Baths
1,620
Sq Ft
$270/Sq Ft
Est. Value
About This Home
This home is located at 6179 Knotty Pine Ct, Port Orange, FL 32127 and is currently estimated at $436,814, approximately $269 per square foot. 6179 Knotty Pine Ct is a home located in Volusia County with nearby schools including Sweetwater Elementary School, Creekside Middle School, and Spruce Creek High School.
Ownership History
Date
Name
Owned For
Owner Type
Purchase Details
Closed on
May 24, 2011
Sold by
Roles Ralph D and Roles Pamela C
Bought by
Lamountain Peter D and Roger Diane L
Current Estimated Value
Purchase Details
Closed on
Aug 18, 2005
Sold by
Hermanson David N and Hermanson Melanie L
Bought by
Roles Ralph D and Roles Pamela C
Home Financials for this Owner
Home Financials are based on the most recent Mortgage that was taken out on this home.
Original Mortgage
$294,000
Interest Rate
5.5%
Mortgage Type
Fannie Mae Freddie Mac
Purchase Details
Closed on
Dec 15, 2003
Sold by
Indigo Group Ltd
Bought by
Hermanson David N and Hermanson Melanie L
Home Financials for this Owner
Home Financials are based on the most recent Mortgage that was taken out on this home.
Original Mortgage
$133,000
Interest Rate
5.97%
Mortgage Type
Purchase Money Mortgage
Create a Home Valuation Report for This Property
The Home Valuation Report is an in-depth analysis detailing your home's value as well as a comparison with similar homes in the area
Home Values in the Area
Average Home Value in this Area
Purchase History
| Date | Buyer | Sale Price | Title Company |
|---|---|---|---|
| Lamountain Peter D | $133,900 | Columbia Title Research Corp | |
| Roles Ralph D | $300,000 | Associated Land Title Group | |
| Hermanson David N | $41,500 | -- |
Source: Public Records
Mortgage History
| Date | Status | Borrower | Loan Amount |
|---|---|---|---|
| Previous Owner | Roles Ralph D | $294,000 | |
| Previous Owner | Hermanson David N | $133,000 |
Source: Public Records
Tax History Compared to Growth
Tax History
| Year | Tax Paid | Tax Assessment Tax Assessment Total Assessment is a certain percentage of the fair market value that is determined by local assessors to be the total taxable value of land and additions on the property. | Land | Improvement |
|---|---|---|---|---|
| 2025 | $5,215 | $358,016 | $90,000 | $268,016 |
| 2024 | $5,215 | $358,575 | $90,000 | $268,575 |
| 2023 | $5,215 | $326,555 | $81,000 | $245,555 |
| 2022 | $4,672 | $279,820 | $46,000 | $233,820 |
| 2021 | $4,353 | $226,621 | $40,000 | $186,621 |
| 2020 | $4,235 | $222,866 | $32,000 | $190,866 |
| 2019 | $3,923 | $207,775 | $30,000 | $177,775 |
| 2018 | $3,703 | $191,127 | $29,000 | $162,127 |
| 2017 | $3,543 | $177,243 | $22,300 | $154,943 |
| 2016 | $3,355 | $163,741 | $0 | $0 |
| 2015 | $3,259 | $160,090 | $0 | $0 |
| 2014 | $2,954 | $142,504 | $0 | $0 |
Source: Public Records
Map
Nearby Homes
- 6180 Knotty Pine Ct
- 6182 Knotty Pine Ct
- 6138 Sequoia Dr
- 6225 Ranier Cir
- 6138 Del Mar Dr
- 433 Nash Ln
- 6230 Cranberry Dr
- 6225 Cranberry Dr
- 6205 Klondike Dr
- 6236 Klondike Dr
- 440 Champagne Cir
- 6215 Yellowstone Dr
- 510 Sun Lake Dr
- 505 Moon Rise Dr
- 513 Sun Lake Dr
- 6043 Galien Ct
- 6317 Palmas Bay Cir
- 522 Sun Lake Dr
- 6325 Palmas Bay Cir
- 6187 Knotty Pine Ct
- 6175 Knotty Pine Ct
- 6185 Knotty Pine Ct
- 6176 Knotty Pine Ct
- 6171 Knotty Pine Ct
- 6174 Knotty Pine Ct
- 6184 Knotty Pine Ct
- 6186 Knotty Pine Ct
- 6170 Knotty Pine Ct
- 6109 Sequoia Dr
- 6188 Knotty Pine Ct
- 6111 Sequoia Dr
- 6151 Del Mar Dr
- 6113 Sequoia Dr
- 6190 Knotty Pine Ct
- 6172 Del Rio Dr
- 6115 Sequoia Dr
- 6148 Del Mar Dr
- 6117 Sequoia Dr
- 6146 Del Mar Dr