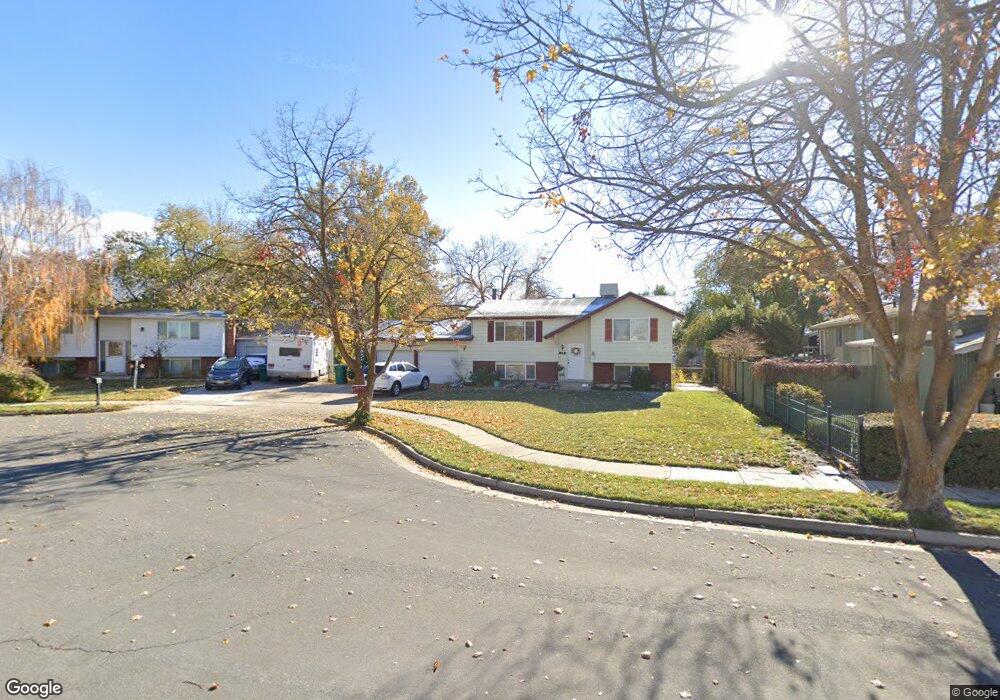
618 Boyce Cir Layton, UT 84041
Estimated Value: $418,000 - $481,000
4
Beds
3
Baths
890
Sq Ft
$495/Sq Ft
Est. Value
About This Home
This home is located at 618 Boyce Cir, Layton, UT 84041 and is currently estimated at $440,716, approximately $495 per square foot. 618 Boyce Cir is a home located in Davis County with nearby schools including Whitesides Elementary School, Fairfield Junior High School, and Layton High School.
Ownership History
Date
Name
Owned For
Owner Type
Purchase Details
Closed on
Mar 25, 2010
Sold by
Johner Jory S
Bought by
Inabnit Aaron L and Inabnit Robyn A
Current Estimated Value
Home Financials for this Owner
Home Financials are based on the most recent Mortgage that was taken out on this home.
Original Mortgage
$147,679
Outstanding Balance
$97,437
Interest Rate
4.89%
Mortgage Type
FHA
Estimated Equity
$343,279
Purchase Details
Closed on
Sep 20, 2006
Sold by
Johner Theresa Skeen
Bought by
Johner Jory S
Purchase Details
Closed on
Sep 14, 2001
Sold by
Johner Jory S
Bought by
Johner Jory S and Johner Theresa Skeen
Home Financials for this Owner
Home Financials are based on the most recent Mortgage that was taken out on this home.
Original Mortgage
$116,176
Interest Rate
7%
Mortgage Type
FHA
Create a Home Valuation Report for This Property
The Home Valuation Report is an in-depth analysis detailing your home's value as well as a comparison with similar homes in the area
Home Values in the Area
Average Home Value in this Area
Purchase History
| Date | Buyer | Sale Price | Title Company |
|---|---|---|---|
| Inabnit Aaron L | -- | First American Title | |
| Johner Jory S | -- | None Available | |
| Johner Jory S | -- | Us Title | |
| Johner Jory S | -- | Equity Title Agency |
Source: Public Records
Mortgage History
| Date | Status | Borrower | Loan Amount |
|---|---|---|---|
| Open | Inabnit Aaron L | $147,679 | |
| Previous Owner | Johner Jory S | $116,176 |
Source: Public Records
Tax History
| Year | Tax Paid | Tax Assessment Tax Assessment Total Assessment is a certain percentage of the fair market value that is determined by local assessors to be the total taxable value of land and additions on the property. | Land | Improvement |
|---|---|---|---|---|
| 2025 | $2,133 | $223,850 | $108,417 | $115,433 |
| 2024 | $2,039 | $215,600 | $126,249 | $89,351 |
| 2023 | $1,937 | $361,000 | $149,364 | $211,636 |
| 2022 | $2,011 | $203,500 | $79,188 | $124,312 |
| 2021 | $1,848 | $279,000 | $111,655 | $167,345 |
| 2020 | $1,637 | $237,000 | $93,707 | $143,293 |
| 2019 | $1,615 | $229,000 | $88,780 | $140,220 |
| 2018 | $1,468 | $209,000 | $88,780 | $120,220 |
| 2016 | $1,262 | $92,675 | $28,521 | $64,154 |
| 2015 | $1,216 | $84,810 | $28,521 | $56,289 |
| 2014 | $1,085 | $77,356 | $28,521 | $48,835 |
| 2013 | -- | $80,800 | $18,612 | $62,188 |
Source: Public Records
Map
Nearby Homes
- 504 E Alice Way
- 464 E Alice Way
- 679 E Clearwater Dr
- 668 E Clearwater Dr
- 811 S Main St
- 617 E 405 S
- 623 E Clearwater Dr Unit 15
- 895 S Main St Unit E
- 905 S Main St Unit G
- 680 N Main St Trlr E-11
- 948 S 250 E
- 282 E 925 S
- 917 S Main St Unit H
- 949 S 225 E
- 772 N Crimson Ln
- 680 N Main St Unit D14
- 753 S 300 E
- 973 E 250 S
- 524 Hyde Park Ln
- 189 S Main St Unit 76
Your Personal Tour Guide
Ask me questions while you tour the home.