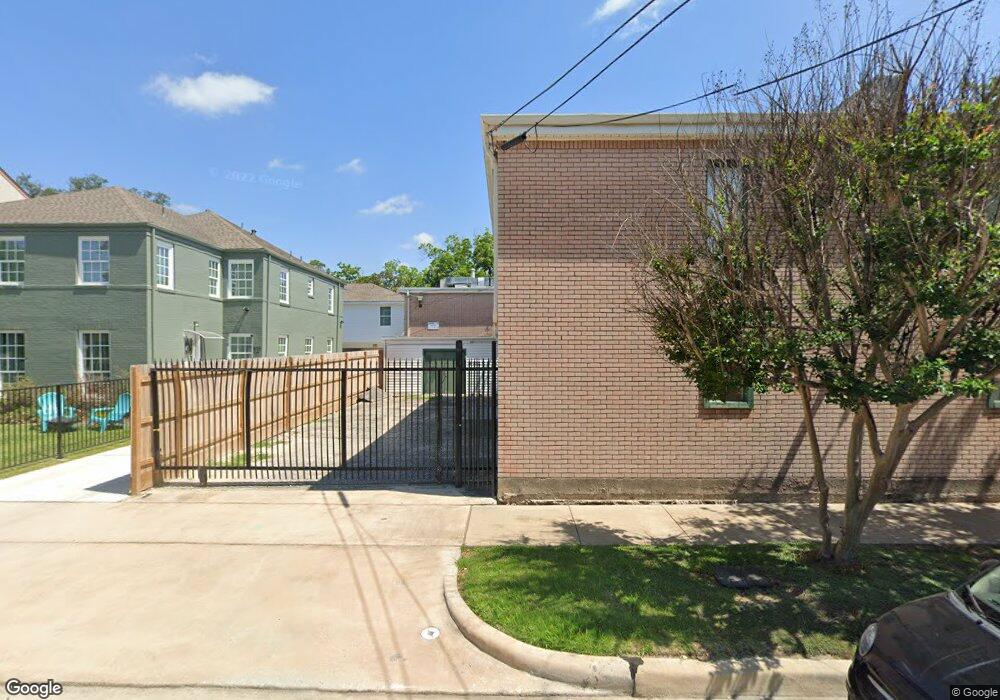
618 Branard St Unit 3 Houston, TX 77006
Montrose NeighborhoodEstimated Value: $1,192,000
4
Beds
7
Baths
1,169
Sq Ft
$1,020/Sq Ft
Est. Value
About This Home
This home is located at 618 Branard St Unit 3, Houston, TX 77006 and is currently estimated at $1,192,000, approximately $1,019 per square foot. 618 Branard St Unit 3 is a home located in Harris County with nearby schools including MacGregor Elementary School, Gregory-Lincoln Ed Center, and Lamar High School.
Ownership History
Date
Name
Owned For
Owner Type
Purchase Details
Closed on
Jun 20, 2025
Sold by
1904 Addison Llc
Bought by
Coira Clan Llc
Current Estimated Value
Home Financials for this Owner
Home Financials are based on the most recent Mortgage that was taken out on this home.
Original Mortgage
$900,000
Outstanding Balance
$890,582
Interest Rate
5.89%
Mortgage Type
New Conventional
Estimated Equity
$301,418
Purchase Details
Closed on
Feb 27, 2020
Sold by
Radney Resources Llc
Bought by
618 Branard Llc
Purchase Details
Closed on
Aug 13, 2019
Sold by
Meyers Alison Jane
Bought by
Radney Resources Llc
Purchase Details
Closed on
Apr 29, 1994
Sold by
Omega House Inc
Bought by
Meyers Alison Jane
Create a Home Valuation Report for This Property
The Home Valuation Report is an in-depth analysis detailing your home's value as well as a comparison with similar homes in the area
Home Values in the Area
Average Home Value in this Area
Purchase History
| Date | Buyer | Sale Price | Title Company |
|---|---|---|---|
| Coira Clan Llc | -- | Chicago Title | |
| 618 Branard Llc | -- | None Available | |
| Radney Resources Llc | -- | None Available | |
| Meyers Alison Jane | -- | Texas American Title Company |
Source: Public Records
Mortgage History
| Date | Status | Borrower | Loan Amount |
|---|---|---|---|
| Open | Coira Clan Llc | $900,000 |
Source: Public Records
Tax History Compared to Growth
Tax History
| Year | Tax Paid | Tax Assessment Tax Assessment Total Assessment is a certain percentage of the fair market value that is determined by local assessors to be the total taxable value of land and additions on the property. | Land | Improvement |
|---|---|---|---|---|
| 2025 | $25,631 | $1,259,235 | $427,240 | $831,995 |
| 2024 | $25,631 | $1,225,000 | $427,240 | $797,760 |
| 2023 | $25,631 | $1,334,141 | $427,240 | $906,901 |
| 2022 | $22,558 | $1,024,500 | $400,538 | $623,962 |
| 2021 | $13,063 | $560,465 | $400,538 | $159,927 |
| 2020 | $11,745 | $516,051 | $400,538 | $115,513 |
| 2019 | $13,158 | $520,000 | $380,625 | $139,375 |
| 2018 | $9,565 | $485,000 | $380,625 | $104,375 |
| 2017 | $12,870 | $485,000 | $380,625 | $104,375 |
| 2016 | $12,870 | $485,000 | $326,250 | $158,750 |
| 2015 | $8,217 | $485,000 | $326,250 | $158,750 |
| 2014 | $8,217 | $435,000 | $271,875 | $163,125 |
Source: Public Records
Map
Nearby Homes
- 708 Sul Ross St
- 705 W Main St
- 4316 & 4320 Jack St
- 816 W Main St
- 4204 Stanford St
- 606 Marshall St Unit 35
- 606 Marshall St Unit 36
- 606 Marshall St Unit 2
- 606 Marshall St Unit 27
- 3613 Audubon Place
- 3603 Audubon Place
- 324 W Alabama St
- 4310 Stanford St
- 4310 Elsbury St
- 3818 Brandt St
- 222 Marshall St
- 706 Oakley St
- 4319 Roseland St
- 3416 Audubon Place
- 612 Harold St
- 618 Branard St Unit 1
- 618 Branard St Unit 2
- 620 Branard St
- 609 Sul Ross St
- 619 Sul Ross St
- 605 Sul Ross St
- 603 Sul Ross St
- 601 Branard St
- 4002 Jack St
- 4009 Greeley St Unit 3
- 4009 Greeley St Unit 1
- 4009 Greeley St Unit 4
- 4009 Greeley St Unit 2
- 520 Branard St
- 514 Branard St
- 514 Branard St Unit 514
- 514 Branard St Unit 1
- 610 W Main St
- 614 W Main St
- 519 Branard St Unit 3