618 E 9th St Mount Vernon, IN 47620
Estimated Value: $155,000 - $177,383
3
Beds
2
Baths
1,196
Sq Ft
$142/Sq Ft
Est. Value
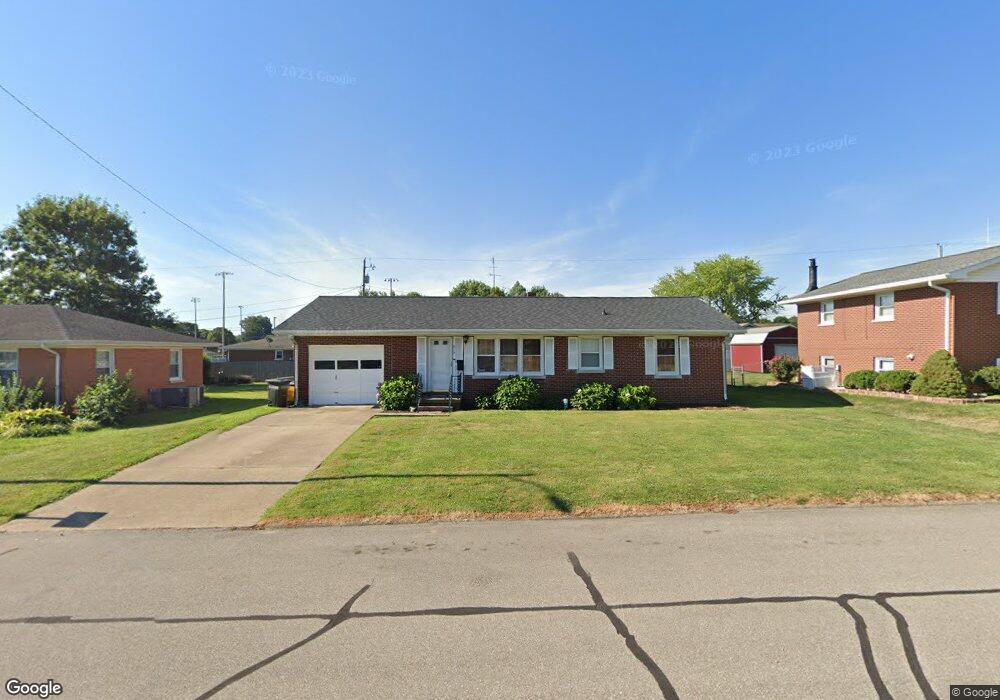
About This Home
This home is located at 618 E 9th St, Mount Vernon, IN 47620 and is currently estimated at $169,596, approximately $141 per square foot. 618 E 9th St is a home located in Posey County with nearby schools including Mount Vernon Junior High School, Mount Vernon High School, and St. Matthew Elementary School.
Ownership History
Date
Name
Owned For
Owner Type
Purchase Details
Closed on
Jul 3, 2015
Sold by
Morlock Christy L
Bought by
Painter Jonathan E
Current Estimated Value
Purchase Details
Closed on
May 4, 2012
Sold by
Morlock Christy L
Bought by
Morlock Christy L and Painter Jonathan E
Purchase Details
Closed on
Jun 29, 2011
Sold by
Calhoun Montreva W
Bought by
Morlock Christy L
Home Financials for this Owner
Home Financials are based on the most recent Mortgage that was taken out on this home.
Original Mortgage
$79,600
Interest Rate
4.56%
Mortgage Type
New Conventional
Create a Home Valuation Report for This Property
The Home Valuation Report is an in-depth analysis detailing your home's value as well as a comparison with similar homes in the area
Home Values in the Area
Average Home Value in this Area
Purchase History
| Date | Buyer | Sale Price | Title Company |
|---|---|---|---|
| Painter Jonathan E | -- | None Available | |
| Morlock Christy L | -- | None Available | |
| Morlock Christy L | -- | None Available |
Source: Public Records
Mortgage History
| Date | Status | Borrower | Loan Amount |
|---|---|---|---|
| Previous Owner | Morlock Christy L | $79,600 |
Source: Public Records
Tax History
| Year | Tax Paid | Tax Assessment Tax Assessment Total Assessment is a certain percentage of the fair market value that is determined by local assessors to be the total taxable value of land and additions on the property. | Land | Improvement |
|---|---|---|---|---|
| 2025 | $1,340 | $138,200 | $13,700 | $124,500 |
| 2024 | $1,340 | $134,000 | $13,700 | $120,300 |
| 2023 | $1,264 | $126,400 | $13,700 | $112,700 |
| 2022 | $1,185 | $118,500 | $13,700 | $104,800 |
| 2021 | $1,024 | $102,400 | $12,000 | $90,400 |
| 2020 | $1,018 | $101,800 | $11,800 | $90,000 |
| 2019 | $978 | $97,800 | $11,300 | $86,500 |
| 2018 | $987 | $98,700 | $11,300 | $87,400 |
| 2017 | $975 | $97,500 | $11,500 | $86,000 |
| 2016 | $949 | $96,000 | $11,700 | $84,300 |
| 2014 | $889 | $95,200 | $11,700 | $83,500 |
| 2013 | $889 | $96,100 | $11,700 | $84,400 |
Source: Public Records
Map
Nearby Homes
Your Personal Tour Guide
Ask me questions while you tour the home.