
Seller's Agent in 2024
David Silva
RE/MAX
(401) 640-3309
3 in this area
67 Total Sales
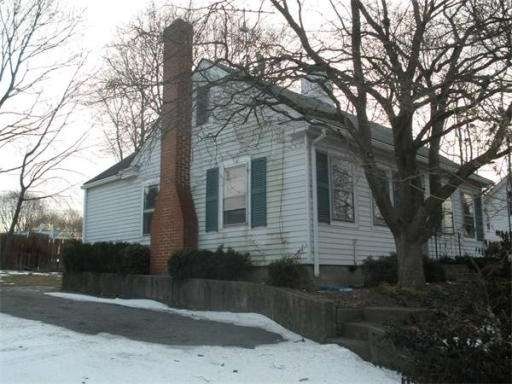
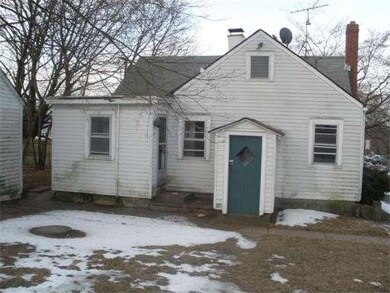
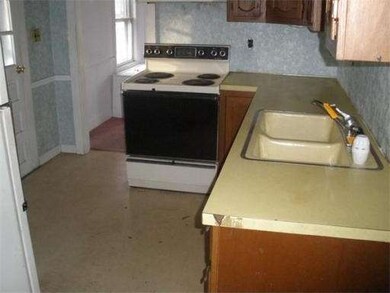
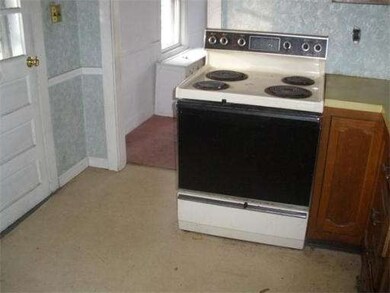
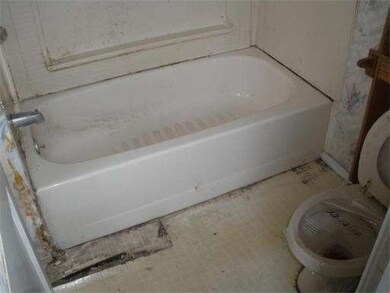
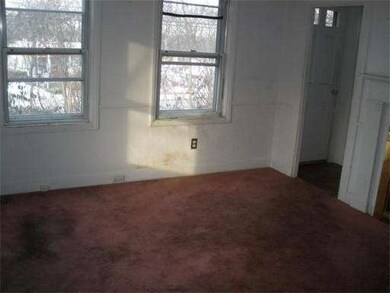
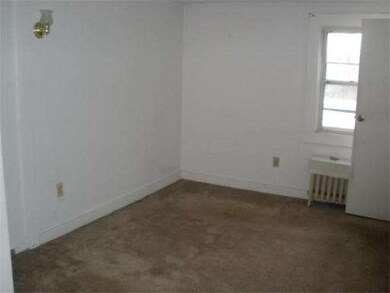
Please READ and FOLLOW showing instructions. Home sold AS IS. All info is deemed reliable but should be verified by buyer's agent or buyer's prior to sending in offer. All offers must have CURRENT proof of funds or CURRENT prequal letter. The best priced winter project in all of Seekonk. Home is in need of some TLC and updating but has great potential. There is even a fireplace in the living room and den.
Last Agent to Sell the Property
Roberts Associates Real Estate Listed on: 01/25/2012
Last Buyer's Agent
Non Member
Non Member Office
Home Type
Single Family
Est. Annual Taxes
$3,543
Year Built
1745
Lot Details
0
| Date | Type | Sale Price | Title Company |
|---|---|---|---|
| Fiduciary Deed | $340,000 | None Available | |
| Fiduciary Deed | $340,000 | None Available | |
| Deed | -- | -- | |
| Foreclosure Deed | $60,000 | -- | |
| Foreclosure Deed | $100,000 | -- | |
| Deed | $100,000 | -- | |
| Deed | -- | -- | |
| Foreclosure Deed | $60,000 | -- | |
| Foreclosure Deed | $100,000 | -- | |
| Deed | $100,000 | -- | |
| Deed | $84,000 | -- |
| Date | Status | Loan Amount | Loan Type |
|---|---|---|---|
| Open | $344,545 | VA | |
| Closed | $340,000 | Purchase Money Mortgage | |
| Previous Owner | $279,720 | Purchase Money Mortgage | |
| Previous Owner | $169,000 | No Value Available | |
| Previous Owner | $130,000 | No Value Available | |
| Previous Owner | $95,000 | Purchase Money Mortgage |
| Date | Event | Price | Change | Sq Ft Price |
|---|---|---|---|---|
| 07/24/2024 07/24/24 | Sold | $340,000 | +7.9% | $427 / Sq Ft |
| 05/12/2024 05/12/24 | Pending | -- | -- | -- |
| 05/08/2024 05/08/24 | For Sale | $315,000 | +16.7% | $396 / Sq Ft |
| 06/15/2021 06/15/21 | Sold | $270,000 | 0.0% | $339 / Sq Ft |
| 05/24/2021 05/24/21 | Pending | -- | -- | -- |
| 04/20/2021 04/20/21 | Off Market | $270,000 | -- | -- |
| 04/16/2021 04/16/21 | Pending | -- | -- | -- |
| 02/01/2021 02/01/21 | For Sale | $274,900 | 0.0% | $345 / Sq Ft |
| 01/20/2021 01/20/21 | Pending | -- | -- | -- |
| 10/21/2020 10/21/20 | For Sale | $274,900 | +472.7% | $345 / Sq Ft |
| 05/21/2012 05/21/12 | Sold | $48,000 | +26.3% | $60 / Sq Ft |
| 02/16/2012 02/16/12 | Pending | -- | -- | -- |
| 01/25/2012 01/25/12 | For Sale | $38,000 | -- | $48 / Sq Ft |
| Year | Tax Paid | Tax Assessment Tax Assessment Total Assessment is a certain percentage of the fair market value that is determined by local assessors to be the total taxable value of land and additions on the property. | Land | Improvement |
|---|---|---|---|---|
| 2025 | $3,543 | $286,900 | $110,200 | $176,700 |
| 2024 | $3,365 | $272,500 | $110,200 | $162,300 |
| 2023 | $3,128 | $238,600 | $89,300 | $149,300 |
| 2022 | $2,577 | $193,200 | $81,500 | $111,700 |
| 2021 | $2,584 | $190,400 | $81,500 | $108,900 |
| 2020 | $2,493 | $189,300 | $81,700 | $107,600 |
| 2019 | $2,402 | $183,900 | $81,700 | $102,200 |
| 2018 | $2,322 | $173,900 | $77,100 | $96,800 |
| 2017 | $2,306 | $171,300 | $75,400 | $95,900 |
| 2016 | $2,268 | $169,100 | $75,400 | $93,700 |
| 2015 | $2,201 | $166,400 | $75,400 | $91,000 |
Seller's Agent in 2024
David Silva
RE/MAX
(401) 640-3309
3 in this area
67 Total Sales
Seller's Agent in 2021
Paul Cutler
Gold Door Realty
(508) 725-0051
1 in this area
18 Total Sales
C
Seller's Agent in 2012
Charles Roberts
Roberts Associates Real Estate
(401) 741-7933
45 Total Sales
N
Buyer's Agent in 2012
Non Member
Non Member Office
Source: MLS Property Information Network (MLS PIN)
MLS Number: 71330843
APN: SEEK-000090-000000-002280
Disclaimer: Certain information contained herein is derived from information provided by parties other than Homes.com. All information provided is deemed reliable, but is not guaranteed to be accurate and should be independently verified.
![]() The property listing data and information, or the Images, set forth herein were provided to MLS Property Information Network, Inc. from third party sources, including sellers, lessors and public records, and were compiled by MLS Property Information Network, Inc. The property listing data and information, and the Images, are for the personal, non-commercial use of consumers having a good faith interest in purchasing or leasing listed properties of the type displayed to them and may not be used for any purpose other than to identify prospective properties which such consumers may have a good faith interest in purchasing or leasing. MLS Property Information Network, Inc. and its subscribers disclaim any and all representations and warranties as to the accuracy of the property listing data and information, or as to the accuracy of any of the Images, set forth herein.
The property listing data and information, or the Images, set forth herein were provided to MLS Property Information Network, Inc. from third party sources, including sellers, lessors and public records, and were compiled by MLS Property Information Network, Inc. The property listing data and information, and the Images, are for the personal, non-commercial use of consumers having a good faith interest in purchasing or leasing listed properties of the type displayed to them and may not be used for any purpose other than to identify prospective properties which such consumers may have a good faith interest in purchasing or leasing. MLS Property Information Network, Inc. and its subscribers disclaim any and all representations and warranties as to the accuracy of the property listing data and information, or as to the accuracy of any of the Images, set forth herein.