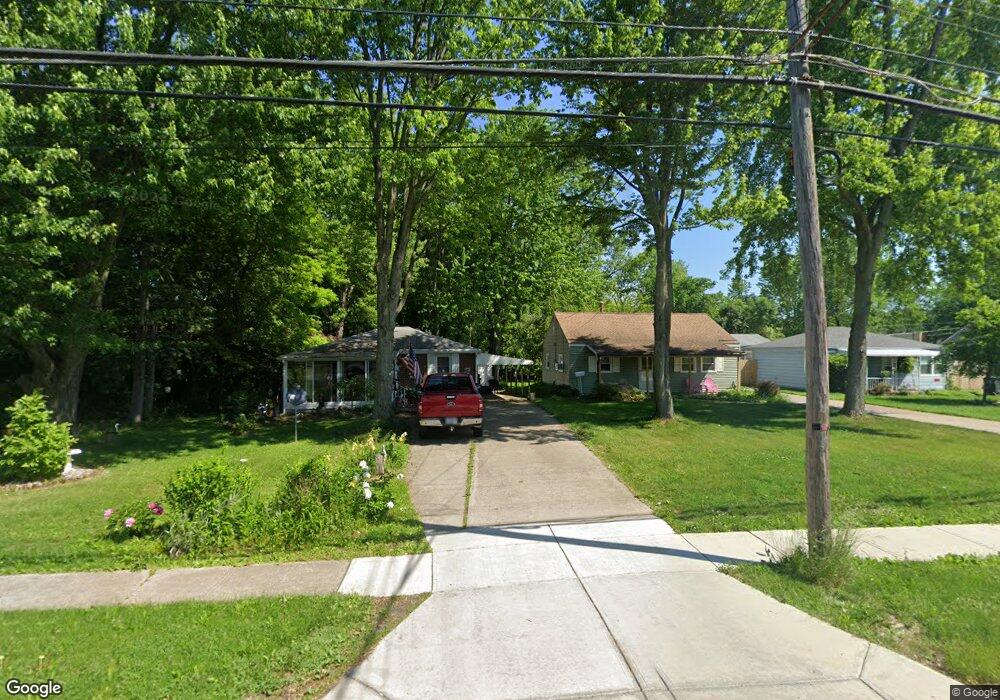
618 Hilliard Rd Elyria, OH 44035
Estimated Value: $137,672 - $154,000
2
Beds
1
Bath
768
Sq Ft
$189/Sq Ft
Est. Value
About This Home
This home is located at 618 Hilliard Rd, Elyria, OH 44035 and is currently estimated at $145,418, approximately $189 per square foot. 618 Hilliard Rd is a home located in Lorain County with nearby schools including Windsor Elementary School, Northwood Middle School, and Elyria High School.
Ownership History
Date
Name
Owned For
Owner Type
Purchase Details
Closed on
Dec 22, 1998
Sold by
Solomon Glenn A and Solomon Traci B
Bought by
Harris Caroline M
Current Estimated Value
Home Financials for this Owner
Home Financials are based on the most recent Mortgage that was taken out on this home.
Original Mortgage
$45,000
Outstanding Balance
$10,434
Interest Rate
7.02%
Estimated Equity
$134,984
Purchase Details
Closed on
Sep 21, 1998
Sold by
Solomon Glenn A and Solomon Traci B
Bought by
Solomon Glenn A and Solomon Traci B
Purchase Details
Closed on
Aug 27, 1998
Sold by
Mcneeley Sean A and Shuba Mary Kay
Bought by
Solomon Glenn A and Solomon Traci B
Purchase Details
Closed on
Dec 1, 1994
Sold by
Campbell Christopher J
Bought by
Solomon Glenn A and Solomon Traci B
Home Financials for this Owner
Home Financials are based on the most recent Mortgage that was taken out on this home.
Original Mortgage
$62,900
Interest Rate
8.91%
Mortgage Type
VA
Create a Home Valuation Report for This Property
The Home Valuation Report is an in-depth analysis detailing your home's value as well as a comparison with similar homes in the area
Home Values in the Area
Average Home Value in this Area
Purchase History
| Date | Buyer | Sale Price | Title Company |
|---|---|---|---|
| Harris Caroline M | $77,000 | Transcounty Title Agency Inc | |
| Solomon Glenn A | -- | -- | |
| Solomon Glenn A | $1,000 | -- | |
| Solomon Glenn A | $62,900 | -- |
Source: Public Records
Mortgage History
| Date | Status | Borrower | Loan Amount |
|---|---|---|---|
| Open | Harris Caroline M | $45,000 | |
| Previous Owner | Solomon Glenn A | $62,900 |
Source: Public Records
Tax History
| Year | Tax Paid | Tax Assessment Tax Assessment Total Assessment is a certain percentage of the fair market value that is determined by local assessors to be the total taxable value of land and additions on the property. | Land | Improvement |
|---|---|---|---|---|
| 2024 | $1,273 | $36,705 | $10,318 | $26,387 |
| 2023 | $1,044 | $28,329 | $8,180 | $20,150 |
| 2022 | $1,063 | $28,329 | $8,180 | $20,150 |
| 2021 | $1,066 | $28,329 | $8,180 | $20,150 |
| 2020 | $938 | $24,090 | $6,960 | $17,130 |
| 2019 | $932 | $24,090 | $6,960 | $17,130 |
| 2018 | $934 | $24,090 | $6,960 | $17,130 |
| 2017 | $840 | $21,960 | $6,290 | $15,670 |
| 2016 | $829 | $21,960 | $6,290 | $15,670 |
| 2015 | $776 | $21,960 | $6,290 | $15,670 |
| 2014 | $767 | $21,960 | $6,290 | $15,670 |
| 2013 | $759 | $21,960 | $6,290 | $15,670 |
Source: Public Records
Map
Nearby Homes
- 455 Metcalf Rd
- 442 Hilliard Rd
- 1073 Rosealee Ave
- 550 Augdon Dr
- 542 Georgetown Ave
- 315 West Glen
- 110 Wilshire Ct
- 113 Coronado Ct
- 1023 Gulf Rd
- 556 Eldemire Ln
- 297 Abbe Rd N
- 208 Alexander Dr
- 220 Alexander Dr
- 714 Hammer Ct
- 940 Bennett Dr
- 837 Jamestown Ave
- 727 Fairwood Blvd
- 897 Livermore Ln
- 926 Sherwood Dr
- 965 Gulf Rd
- 616 Hilliard Rd
- 622 Hilliard Rd
- 624 Hilliard Rd
- 612 Hilliard Rd
- 987 Rosealee Ave
- 626 Hilliard Rd
- 991 Rosealee Ave
- 623 Hilliard Rd
- 626 Rear Land Rd
- 621 Hilliard Rd
- 628 Hilliard Rd
- 995 Rosealee Ave
- 583 Hilliard Rd
- 630 Hilliard Rd
- 629 Hilliard Rd
- 625 Hilliard Rd
- 579 Hilliard Rd
- 630 Rear Land Rd
- 984 Rosealee Ave
- 632 Hilliard Rd
Your Personal Tour Guide
Ask me questions while you tour the home.