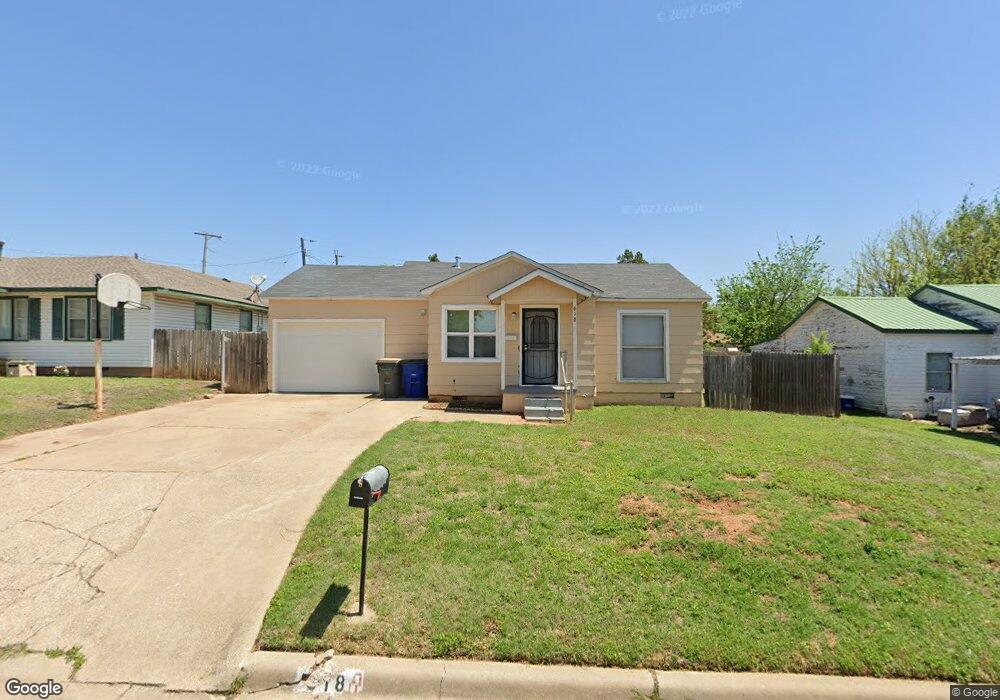
618 N E St Duncan, OK 73533
Estimated Value: $48,000 - $53,000
2
Beds
1
Bath
835
Sq Ft
$60/Sq Ft
Est. Value
About This Home
This home is located at 618 N E St, Duncan, OK 73533 and is currently estimated at $50,161, approximately $60 per square foot. 618 N E St is a home located in Stephens County with nearby schools including Woodrow Wilson Elementary School, Duncan Middle School, and Duncan High School.
Ownership History
Date
Name
Owned For
Owner Type
Purchase Details
Closed on
Aug 27, 2020
Sold by
Twelve Stones Properties Llc
Bought by
Ace Properties Llc
Current Estimated Value
Home Financials for this Owner
Home Financials are based on the most recent Mortgage that was taken out on this home.
Original Mortgage
$22,066
Outstanding Balance
$11,647
Interest Rate
2.9%
Mortgage Type
Credit Line Revolving
Estimated Equity
$38,514
Purchase Details
Closed on
Nov 8, 2017
Sold by
Ibarra Ismael
Bought by
Twelve Stone Properties Llc
Purchase Details
Closed on
Apr 17, 2016
Sold by
Ibarra Rene and Ibarra Hortencia
Bought by
Ibarra Ismaee
Purchase Details
Closed on
Sep 28, 1999
Sold by
Jones Billie R and Jones Sheila
Bought by
Ibarra Rene and Ibarra Hortencia
Purchase Details
Closed on
Jun 21, 1994
Sold by
Lyons Beatrice
Create a Home Valuation Report for This Property
The Home Valuation Report is an in-depth analysis detailing your home's value as well as a comparison with similar homes in the area
Purchase History
| Date | Buyer | Sale Price | Title Company |
|---|---|---|---|
| Ace Properties Llc | $21,000 | Stephens County Abstract Co | |
| Twelve Stone Properties Llc | $21,000 | None Available | |
| Ibarra Ismaee | -- | None Available | |
| Ibarra Rene | $15,000 | -- | |
| -- | $15,000 | -- |
Source: Public Records
Mortgage History
| Date | Status | Borrower | Loan Amount |
|---|---|---|---|
| Open | Ace Properties Llc | $22,066 |
Source: Public Records
Tax History
| Year | Tax Paid | Tax Assessment Tax Assessment Total Assessment is a certain percentage of the fair market value that is determined by local assessors to be the total taxable value of land and additions on the property. | Land | Improvement |
|---|---|---|---|---|
| 2025 | $258 | $3,059 | $494 | $2,565 |
| 2024 | $236 | $2,775 | $494 | $2,281 |
| 2023 | $236 | $2,775 | $494 | $2,281 |
| 2022 | $214 | $2,643 | $494 | $2,149 |
| 2021 | $204 | $2,397 | $494 | $1,903 |
| 2020 | $190 | $2,205 | $494 | $1,711 |
| 2019 | $188 | $2,175 | $494 | $1,681 |
| 2018 | $313 | $3,513 | $494 | $3,019 |
| 2017 | $235 | $2,870 | $494 | $2,376 |
| 2016 | $221 | $2,603 | $494 | $2,109 |
| 2015 | $187 | $2,479 | $494 | $1,985 |
| 2014 | $187 | $2,361 | $494 | $1,867 |
Source: Public Records
Map
Nearby Homes
Your Personal Tour Guide
Ask me questions while you tour the home.