M
Seller's Agent in 2023
Michelle Tucker
MALONE REALTY
(812) 208-7080
59 in this area
130 Total Sales

Estimated Value: $92,000 - $114,702
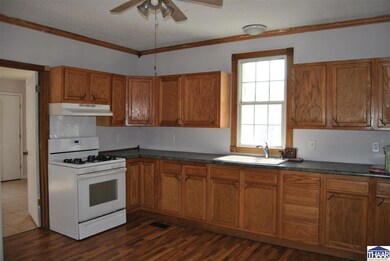
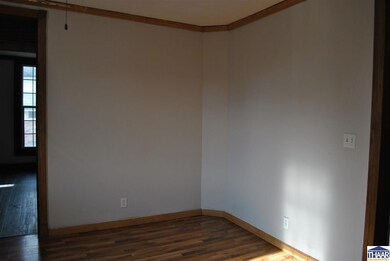
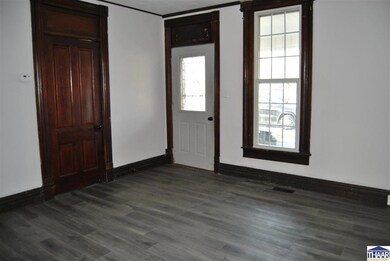
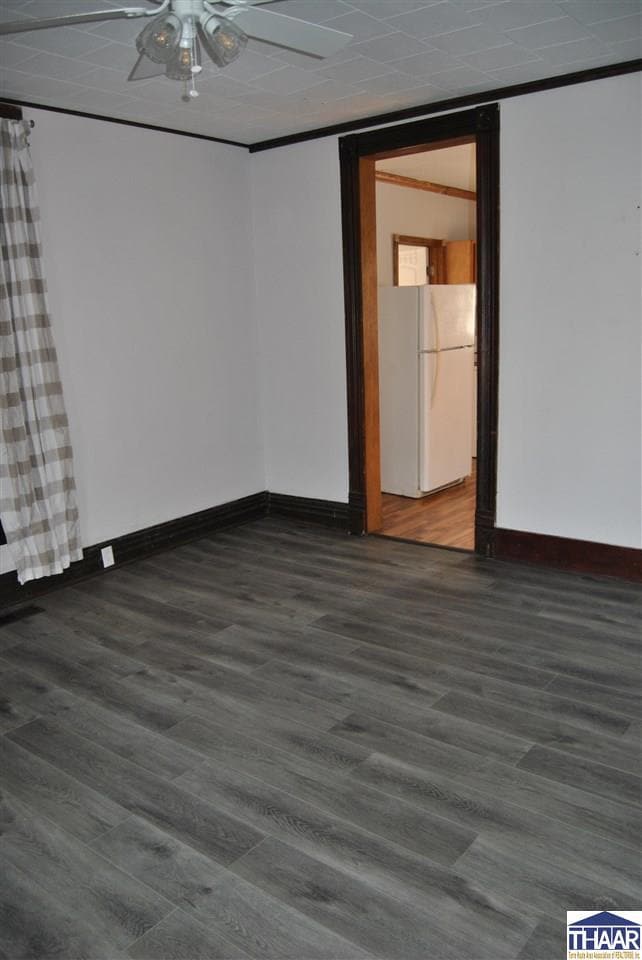
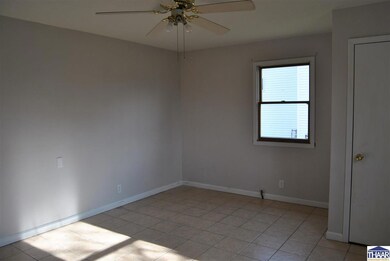
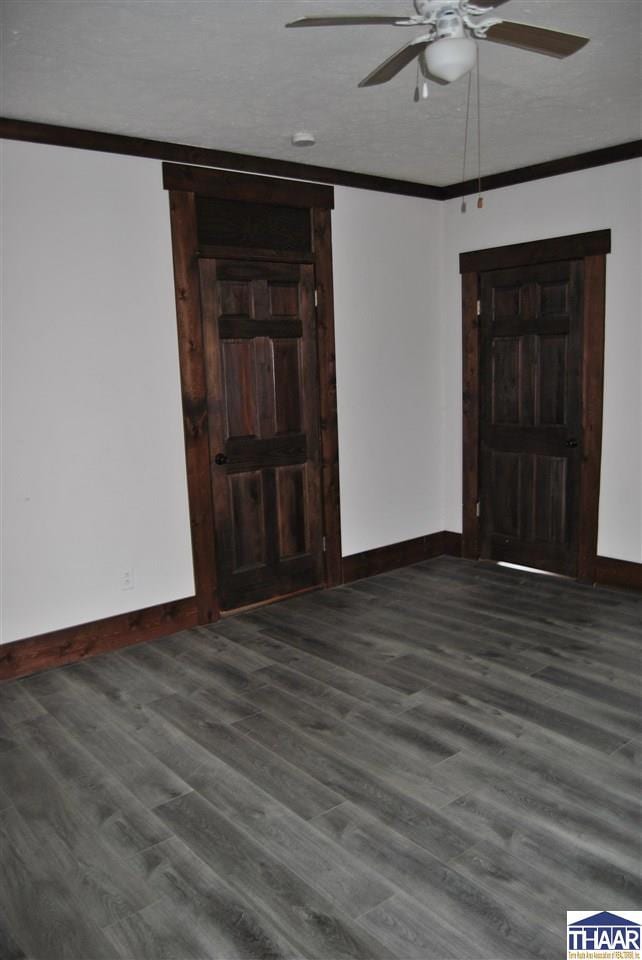
3 bedroom possible 4th- full basement newer kitchen, laundry room on main level- newer rear wood deck. Former attached garage finished for office could be 4th bedroom or turned back to garage. Newer roof only 2 years old. Metal fence.
Last Agent to Sell the Property
MALONE REALTY License #RB14016374 Listed on: 01/02/2023
Last Buyer's Agent
HOUSE MALONE REAL ESTATE
MALONE REALTY
| Date | Buyer | Sale Price | Title Company |
|---|---|---|---|
| Richards Rex A | $74,900 | None Listed On Document | |
| Cottrell Properties Llc | $12,000 | None Listed On Document | |
| Vca Llc | $7,000 | None Listed On Document | |
| Leigh Scott A | -- | -- | |
| Gray Coty | $40,000 | -- | |
| Gray Coty | $40,000 | -- |
| Date | Status | Borrower | Loan Amount |
|---|---|---|---|
| Open | Richards Rex A | $71,155 |
| Date | Event | Price | List to Sale | Price per Sq Ft |
|---|---|---|---|---|
| 02/16/2023 02/16/23 | Sold | $74,900 | 0.0% | $51 / Sq Ft |
| 01/06/2023 01/06/23 | Pending | -- | -- | -- |
| 01/02/2023 01/02/23 | For Sale | $74,900 | -- | $51 / Sq Ft |
| Year | Tax Paid | Tax Assessment Tax Assessment Total Assessment is a certain percentage of the fair market value that is determined by local assessors to be the total taxable value of land and additions on the property. | Land | Improvement |
|---|---|---|---|---|
| 2024 | $846 | $86,200 | $14,600 | $71,600 |
| 2023 | $741 | $79,100 | $14,600 | $64,500 |
| 2022 | $1,596 | $79,800 | $14,600 | $65,200 |
| 2021 | $1,450 | $72,500 | $14,600 | $57,900 |
| 2020 | $1,314 | $65,700 | $18,000 | $47,700 |
| 2019 | $978 | $48,900 | $8,900 | $40,000 |
| 2018 | $978 | $48,900 | $8,900 | $40,000 |
| 2017 | $966 | $48,300 | $8,900 | $39,400 |
| 2016 | $470 | $47,000 | $8,900 | $38,100 |
| 2014 | $326 | $45,900 | $8,900 | $37,000 |
| 2013 | $326 | $45,900 | $8,900 | $37,000 |
M
Seller's Agent in 2023
Michelle Tucker
MALONE REALTY
(812) 208-7080
59 in this area
130 Total Sales
H
Buyer's Agent in 2023
HOUSE MALONE REAL ESTATE
MALONE REALTY
Source: Terre Haute Area Association of REALTORS®
MLS Number: 99731
APN: 83-13-15-336-006.000-002
