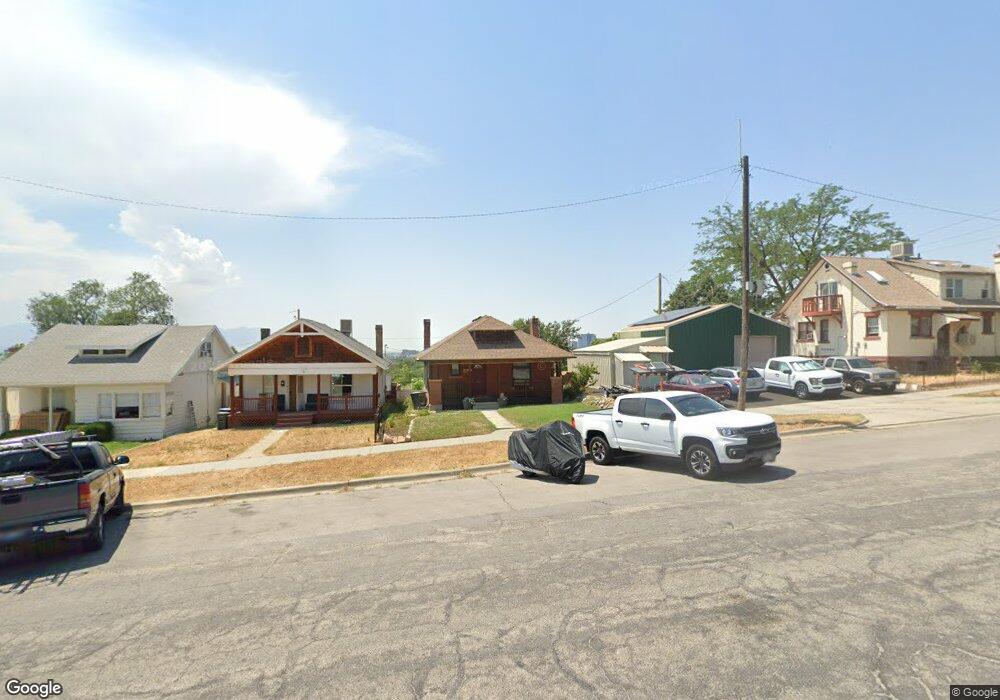
618 S 1000 E Salt Lake City, UT 84102
East Central NeighborhoodEstimated Value: $481,000 - $580,000
3
Beds
1
Bath
980
Sq Ft
$557/Sq Ft
Est. Value
About This Home
This home is located at 618 S 1000 E, Salt Lake City, UT 84102 and is currently estimated at $546,198, approximately $557 per square foot. 618 S 1000 E is a home located in Salt Lake County with nearby schools including Bennion Elementary School, Wasatch Elementary School, and East High School.
Ownership History
Date
Name
Owned For
Owner Type
Purchase Details
Closed on
Sep 21, 2016
Sold by
Casimir Craig R
Bought by
Casimir Craig Ronald
Current Estimated Value
Home Financials for this Owner
Home Financials are based on the most recent Mortgage that was taken out on this home.
Original Mortgage
$185,958
Outstanding Balance
$148,632
Interest Rate
3.45%
Mortgage Type
VA
Estimated Equity
$397,566
Purchase Details
Closed on
Aug 24, 2016
Sold by
Casimir Craig R and Louviere Mary Thompson
Bought by
Casimir Craig R
Home Financials for this Owner
Home Financials are based on the most recent Mortgage that was taken out on this home.
Original Mortgage
$185,958
Outstanding Balance
$148,632
Interest Rate
3.45%
Mortgage Type
VA
Estimated Equity
$397,566
Purchase Details
Closed on
Jun 24, 2009
Sold by
Woods Cross Management Llc
Bought by
Louviere Mary T
Purchase Details
Closed on
Jun 16, 2008
Sold by
Casimir Craig R
Bought by
Woods Cross Management Llc
Create a Home Valuation Report for This Property
The Home Valuation Report is an in-depth analysis detailing your home's value as well as a comparison with similar homes in the area
Home Values in the Area
Average Home Value in this Area
Purchase History
| Date | Buyer | Sale Price | Title Company |
|---|---|---|---|
| Casimir Craig Ronald | -- | Metro National Title | |
| Casimir Craig R | -- | Metro National Title | |
| Louviere Mary T | -- | None Available | |
| Woods Cross Management Llc | -- | None Available | |
| Woods Cross Management Llc | -- | None Available | |
| Casimir Craig R | -- | None Available |
Source: Public Records
Mortgage History
| Date | Status | Borrower | Loan Amount |
|---|---|---|---|
| Open | Casimir Craig Ronald | $185,958 |
Source: Public Records
Tax History Compared to Growth
Tax History
| Year | Tax Paid | Tax Assessment Tax Assessment Total Assessment is a certain percentage of the fair market value that is determined by local assessors to be the total taxable value of land and additions on the property. | Land | Improvement |
|---|---|---|---|---|
| 2025 | $2,463 | $465,900 | $179,900 | $286,000 |
| 2024 | $2,463 | $470,000 | $170,200 | $299,800 |
| 2023 | $2,458 | $452,100 | $163,700 | $288,400 |
| 2022 | $2,663 | $459,500 | $160,500 | $299,000 |
| 2021 | $2,491 | $389,200 | $123,100 | $266,100 |
| 2020 | $1,947 | $289,500 | $112,000 | $177,500 |
| 2019 | $2,011 | $281,300 | $105,500 | $175,800 |
| 2018 | $1,800 | $245,200 | $105,500 | $139,700 |
| 2017 | $1,804 | $230,300 | $105,500 | $124,800 |
| 2016 | $367 | $220,300 | $86,400 | $133,900 |
| 2015 | $1,450 | $166,600 | $89,000 | $77,600 |
| 2014 | $80 | $158,600 | $87,300 | $71,300 |
Source: Public Records
Map
Nearby Homes
- 915 E 600 S
- 531 S 900 E Unit B3
- 606 S 900 E
- 525 S 900 E Unit B2
- 543 S 900 E Unit A11
- 552 S Mcclelland St
- 551 S Mcclelland St
- 515 S 1000 E Unit 706
- 515 S 1000 E Unit 406
- 515 S 1000 E Unit 1104
- 515 S 1000 E Unit 504
- 938 E Lowell Ave
- 504 S 900 E
- 1011 E 800 S
- 1021 E 800 S
- 1031 E 800 S
- 1117 E 700 S
- 717 S 800 E
- 426 S 1000 E Unit 600
- 426 S 1000 E Unit 707