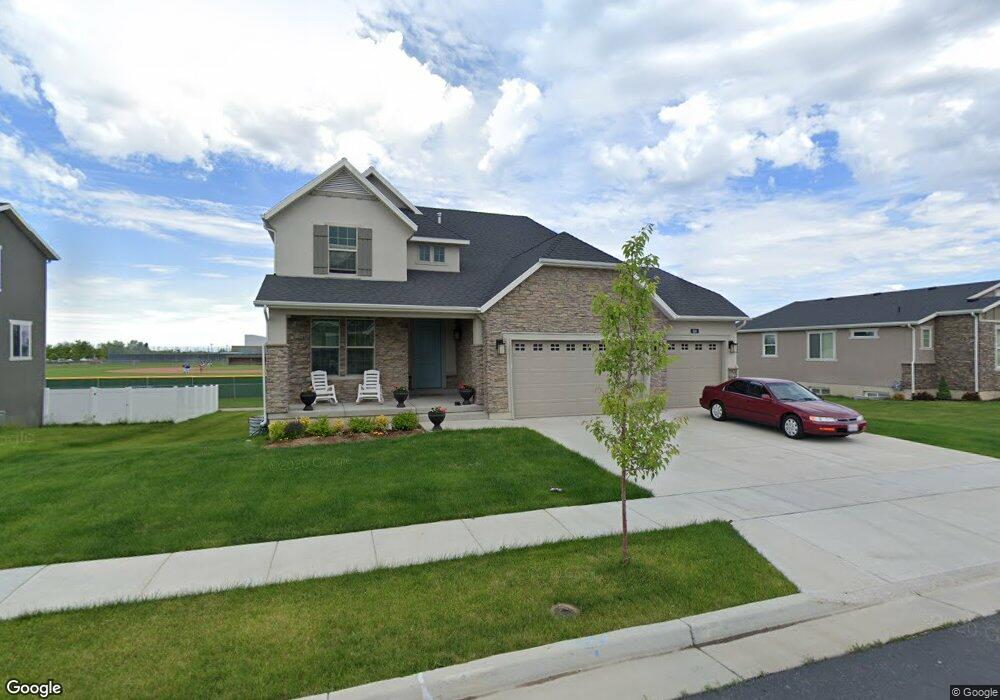
618 S 1550 W Syracuse, UT 84075
Estimated Value: $635,000 - $664,000
3
Beds
3
Baths
3,308
Sq Ft
$198/Sq Ft
Est. Value
About This Home
This home is located at 618 S 1550 W, Syracuse, UT 84075 and is currently estimated at $653,973, approximately $197 per square foot. 618 S 1550 W is a home located in Davis County with nearby schools including Cook School, Syracuse Junior High School, and Syracuse High School.
Ownership History
Date
Name
Owned For
Owner Type
Purchase Details
Closed on
Feb 25, 2019
Sold by
Snell Jaren and Snell Robyn
Bought by
Thompson Victoria and Thompson Taylor Jay
Current Estimated Value
Home Financials for this Owner
Home Financials are based on the most recent Mortgage that was taken out on this home.
Original Mortgage
$366,660
Outstanding Balance
$321,702
Interest Rate
4.4%
Mortgage Type
New Conventional
Estimated Equity
$332,271
Purchase Details
Closed on
Jul 8, 2016
Sold by
Ivory Homes Ltd
Bought by
Snell Jaren and Snell Robyn
Create a Home Valuation Report for This Property
The Home Valuation Report is an in-depth analysis detailing your home's value as well as a comparison with similar homes in the area
Home Values in the Area
Average Home Value in this Area
Purchase History
| Date | Buyer | Sale Price | Title Company |
|---|---|---|---|
| Thompson Victoria | -- | Old Republic Natl | |
| Snell Jaren | -- | Cottonwood Title | |
| Ivory Homes Ltd | -- | Cottonwood Title |
Source: Public Records
Mortgage History
| Date | Status | Borrower | Loan Amount |
|---|---|---|---|
| Open | Thompson Victoria | $366,660 |
Source: Public Records
Tax History Compared to Growth
Tax History
| Year | Tax Paid | Tax Assessment Tax Assessment Total Assessment is a certain percentage of the fair market value that is determined by local assessors to be the total taxable value of land and additions on the property. | Land | Improvement |
|---|---|---|---|---|
| 2025 | $3,415 | $329,450 | $119,915 | $209,535 |
| 2024 | $3,397 | $330,000 | $94,583 | $235,417 |
| 2023 | $3,254 | $576,000 | $132,047 | $443,953 |
| 2022 | $3,497 | $339,351 | $76,632 | $262,719 |
| 2021 | $3,009 | $452,000 | $112,730 | $339,270 |
| 2020 | $2,703 | $393,000 | $100,492 | $292,508 |
| 2019 | $2,654 | $381,000 | $95,433 | $285,567 |
| 2018 | $0 | $351,000 | $93,659 | $257,341 |
| 2016 | $2,359 | $176,275 | $36,051 | $140,224 |
Source: Public Records
Map
Nearby Homes
- 587 S 1400 W
- 916 S 1760 W
- 922 S 1760 W
- 817 S 1350 W
- 1648 W 150 S
- 135 S 1525 W
- 4284 W 350 S Unit 615
- 4296 W 350 S Unit 614
- 1828 W 75 S
- 1097 W 850 S
- 1251 S 1650 W
- 47 N 1750 W
- 16 N 1300 W
- 12 N 2000 W Unit 1
- 1327 S 1650 W
- 1166 Dallas St
- 2050 Craftsman Plan at Legacy Park - Collection
- 2200 Garden Plan at Legacy Park - Collection
- Lincoln Farmhouse Plan at Legacy Park - Estates
- Hamilton Traditional Plan at Legacy Park - Estates