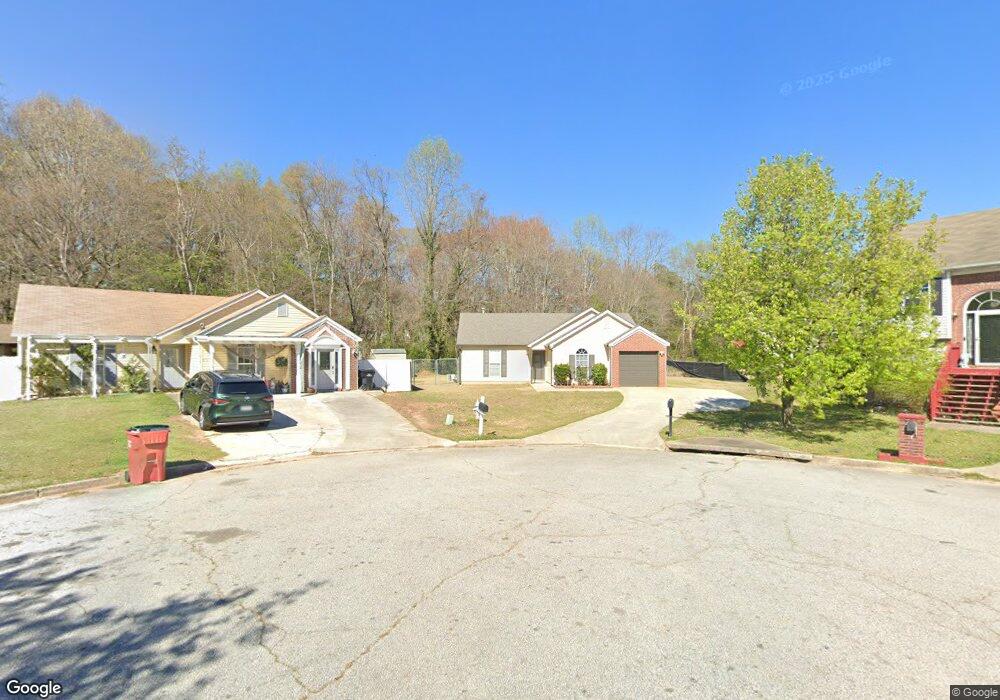
6180 Green Wing Way Morrow, GA 30260
Estimated Value: $239,000 - $298,000
3
Beds
2
Baths
2,542
Sq Ft
$102/Sq Ft
Est. Value
About This Home
This home is located at 6180 Green Wing Way, Morrow, GA 30260 and is currently estimated at $259,913, approximately $102 per square foot. 6180 Green Wing Way is a home located in Clayton County with nearby schools including Thurgood Marshall Elementary School, Adamson Middle School, and Morrow High School.
Ownership History
Date
Name
Owned For
Owner Type
Purchase Details
Closed on
Nov 2, 2018
Sold by
Jackson Gregory
Bought by
Robinson Harvey E
Current Estimated Value
Home Financials for this Owner
Home Financials are based on the most recent Mortgage that was taken out on this home.
Original Mortgage
$98,188
Outstanding Balance
$85,540
Interest Rate
4.75%
Mortgage Type
FHA
Estimated Equity
$174,373
Purchase Details
Closed on
Nov 12, 2001
Sold by
Jackson Tim N
Bought by
Jackson Gregory
Purchase Details
Closed on
Aug 30, 1999
Sold by
Gt Architecture Contractors Corp
Bought by
Jackson Gregory and Jackson Tina N
Home Financials for this Owner
Home Financials are based on the most recent Mortgage that was taken out on this home.
Original Mortgage
$88,241
Interest Rate
8.22%
Mortgage Type
FHA
Create a Home Valuation Report for This Property
The Home Valuation Report is an in-depth analysis detailing your home's value as well as a comparison with similar homes in the area
Home Values in the Area
Average Home Value in this Area
Purchase History
| Date | Buyer | Sale Price | Title Company |
|---|---|---|---|
| Robinson Harvey E | $100,000 | -- | |
| Jackson Gregory | -- | -- | |
| Jackson Gregory | $89,000 | -- |
Source: Public Records
Mortgage History
| Date | Status | Borrower | Loan Amount |
|---|---|---|---|
| Open | Robinson Harvey E | $98,188 | |
| Previous Owner | Jackson Gregory | $88,241 |
Source: Public Records
Tax History Compared to Growth
Tax History
| Year | Tax Paid | Tax Assessment Tax Assessment Total Assessment is a certain percentage of the fair market value that is determined by local assessors to be the total taxable value of land and additions on the property. | Land | Improvement |
|---|---|---|---|---|
| 2024 | $3,821 | $106,960 | $7,200 | $99,760 |
| 2023 | $3,156 | $87,400 | $7,200 | $80,200 |
| 2022 | $2,925 | $83,560 | $7,200 | $76,360 |
| 2021 | $2,610 | $75,120 | $7,200 | $67,920 |
| 2020 | $1,496 | $46,454 | $7,200 | $39,254 |
| 2019 | $1,256 | $40,000 | $6,000 | $34,000 |
| 2018 | $1,662 | $40,001 | $6,000 | $34,001 |
| 2017 | $1,160 | $27,585 | $6,000 | $21,585 |
| 2016 | $763 | $27,817 | $6,000 | $21,817 |
| 2015 | $751 | $0 | $0 | $0 |
| 2014 | $687 | $26,292 | $6,000 | $20,292 |
Source: Public Records
Map
Nearby Homes
- 6188 Cinnamon Ct
- 2306 Santa fe St Unit 9
- 2278 Santa fe St Unit 18
- 2280 Santa fe St Unit 17
- 2718 Somerton Dr
- 6082 Kathie Ct
- 6076 Mount Zion Blvd
- 2731 Lynn Ct
- 6050 Randy Ln
- 2649 Lake Harbin Rd
- 2609 Lake Harbin Rd
- 2820 Rex Rd
- 6397 E Meyer Dr
- 2835 Randy Ct Unit 4
- 6205 Fieldcrest Dr
- 2811 Appaloosa Run
- 6389 Warbler Ct
- 6383 Warbler Ct
- 6379 Warbler Ct
- 6381 Warbler Ct
- 6181 Green Wing Way
- 6184 Green Wing Way
- 2816 Teal Landing Dr
- 2820 Teal Landing Dr
- 2812 Teal Landing Dr
- 6185 Green Wing Way
- 6192 Green Wing Way
- 0 Green Wing Way
- 6189 Green Wing Way
- 2804 Teal Landing Dr
- 6195 Green Wing Way
- 2819 Teal Landing Dr
- 6200 Green Wing Way
- 6182 Cinnamon Ct
- 2815 Teal Landing Dr
- 6203 Green Wing Way
- 2796 Teal Landing Dr
- 2807 Teal Landing Dr
- 6196 Cinnamon Ct
- 6208 Green Wing Way