Estimated Value: $197,000 - $264,000
3
Beds
2
Baths
1,462
Sq Ft
$160/Sq Ft
Est. Value
About This Home
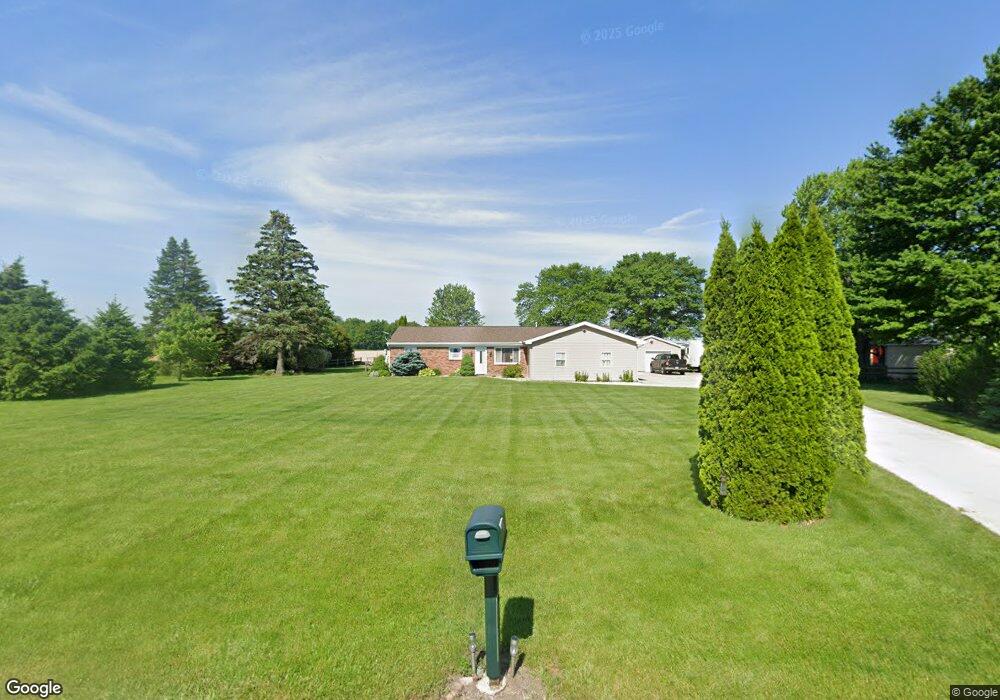
This home is located at 6181 County Road 5, Delta, OH 43515 and is currently estimated at $233,228, approximately $159 per square foot. 6181 County Road 5 is a home located in Fulton County with nearby schools including Delta Elementary School, Pike-Delta-York Middle School, and Pike-Delta-York High School.
Ownership History
Date
Name
Owned For
Owner Type
Purchase Details
Closed on
Dec 19, 2013
Sold by
Lahman Joy M
Bought by
Lester Jessica M
Current Estimated Value
Home Financials for this Owner
Home Financials are based on the most recent Mortgage that was taken out on this home.
Original Mortgage
$116,000
Outstanding Balance
$87,280
Interest Rate
4.38%
Mortgage Type
New Conventional
Estimated Equity
$145,948
Purchase Details
Closed on
Oct 15, 2008
Sold by
Lesher Donald E
Bought by
Lahman Joy M
Purchase Details
Closed on
Aug 7, 2000
Sold by
Williamson Charles T
Bought by
Spiess Joy M
Home Financials for this Owner
Home Financials are based on the most recent Mortgage that was taken out on this home.
Original Mortgage
$104,850
Interest Rate
8.19%
Mortgage Type
New Conventional
Purchase Details
Closed on
Jan 1, 1990
Bought by
Williamson Charles T
Create a Home Valuation Report for This Property
The Home Valuation Report is an in-depth analysis detailing your home's value as well as a comparison with similar homes in the area
Home Values in the Area
Average Home Value in this Area
Purchase History
| Date | Buyer | Sale Price | Title Company |
|---|---|---|---|
| Lester Jessica M | $145,000 | Attorney | |
| Lahman Joy M | -- | Attorney | |
| Spiess Joy M | $108,100 | -- | |
| Williamson Charles T | -- | -- |
Source: Public Records
Mortgage History
| Date | Status | Borrower | Loan Amount |
|---|---|---|---|
| Open | Lester Jessica M | $116,000 | |
| Previous Owner | Spiess Joy M | $104,850 |
Source: Public Records
Tax History Compared to Growth
Tax History
| Year | Tax Paid | Tax Assessment Tax Assessment Total Assessment is a certain percentage of the fair market value that is determined by local assessors to be the total taxable value of land and additions on the property. | Land | Improvement |
|---|---|---|---|---|
| 2024 | $2,599 | $66,400 | $8,610 | $57,790 |
| 2023 | $2,599 | $66,400 | $8,610 | $57,790 |
| 2022 | $2,479 | $49,990 | $7,180 | $42,810 |
| 2021 | $2,523 | $49,990 | $7,180 | $42,810 |
| 2020 | $2,556 | $49,990 | $7,180 | $42,810 |
| 2019 | $2,188 | $44,420 | $7,040 | $37,380 |
| 2018 | $1,898 | $39,630 | $7,040 | $32,590 |
| 2017 | $1,883 | $39,630 | $7,040 | $32,590 |
| 2016 | $1,883 | $37,460 | $7,040 | $30,420 |
| 2015 | $1,793 | $37,460 | $7,040 | $30,420 |
| 2014 | $1,807 | $37,460 | $7,040 | $30,420 |
| 2013 | $1,911 | $39,450 | $7,740 | $31,710 |
Source: Public Records
Map
Nearby Homes
- 4329 County Road 1 #2
- 3121 County Road Ef
- 908 Fernwood St
- 6854 County Road 3
- 518 Providence St
- 701 Palmwood St
- 305 Mckinley St
- 413 Fernwood St
- 207 Wood St
- 810 Greenview Ave
- 308 Monroe St
- 201 Elmwood Ave
- 2121 Holiday Dr
- 2076 County Rd E
- 7893 County Road 2
- 2511 County Road D
- 1932 County Road D
- 113 West St
- 6042 County Road 1-1
- 1200 County Road F
- 6207 County Road 5
- 6155 County Road 5
- 6235 County Road 5
- 6088 County Road 5
- 6351 County Road 5
- 5229 County Road 5
- 0 County Road 5
- 8455 County Road 5
- 6520 County Road 5
- 6550 County Road 5
- 5276 County Road F
- 5810 County Road 5
- 4632 County Road Fg
- 5225 County Road F
- 1 County Road 5
- 0 County Road 5
- 6600 County Road 5
- 5371 County Road F
- 4851 County Road Ef
- 5480 County Road F