F
Landlord's Agent in 2014
Fernando Bartolomei
Vestlet Property Management
(678) 300-1781
9 Total Sales
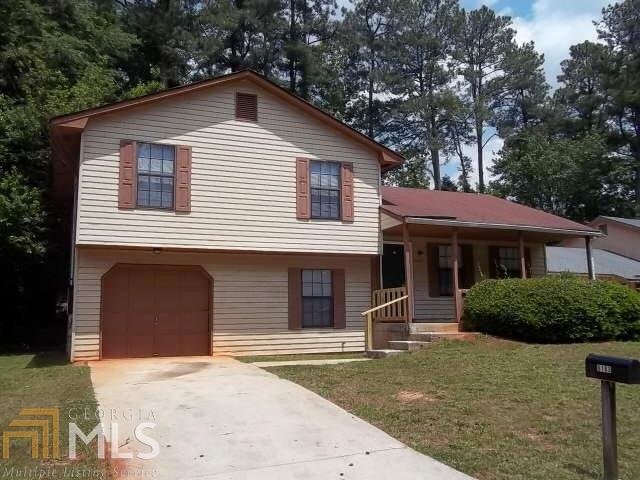
Estimated Value: $223,573 - $257,000
SPACIOUS 3BR 2BA HOME IN QUIET ESTABLISHED NEIGHBORHOOD, PROPERY MANAGED, APPLIANCES INCLUDED, MOVE I READY, MUST SEE
Last Agent to Rent the Property
Vestlet Property Management License #171516 Listed on: 07/21/2014
| Date | Buyer | Sale Price | Title Company |
|---|---|---|---|
| Sfr Investments V Borrower 1 Llc | $4,718,385 | -- | |
| Sfr Investments V Borrower 1 Llc | $4,718,385 | -- | |
| Zillow Homes Property Trust | $218,364 | -- | |
| Dunwoody Investment Properties | -- | -- | |
| Smith Ronald M | -- | -- | |
| Hud-Housing Of Urban Dev | -- | -- | |
| Citimortgage Inc | $45,564 | -- | |
| Charring Cross Ct Land Tu | $102,000 | -- |
| Date | Status | Borrower | Loan Amount |
|---|---|---|---|
| Previous Owner | Charring Cross Ct Land Tu | $47,992 |
| Date | Event | Price | List to Sale | Price per Sq Ft |
|---|---|---|---|---|
| 08/20/2014 08/20/14 | Rented | $800 | 0.0% | -- |
| 07/21/2014 07/21/14 | Under Contract | -- | -- | -- |
| 07/21/2014 07/21/14 | For Rent | $800 | -- | -- |
| Year | Tax Paid | Tax Assessment Tax Assessment Total Assessment is a certain percentage of the fair market value that is determined by local assessors to be the total taxable value of land and additions on the property. | Land | Improvement |
|---|---|---|---|---|
| 2025 | $4,931 | $102,600 | $15,390 | $87,210 |
| 2024 | $4,930 | $102,600 | $15,000 | $87,600 |
| 2023 | $4,930 | $97,520 | $15,000 | $82,520 |
| 2022 | $4,043 | $84,440 | $15,000 | $69,440 |
| 2021 | $2,505 | $49,400 | $4,040 | $45,360 |
| 2020 | $2,217 | $42,840 | $4,040 | $38,800 |
| 2019 | $1,915 | $35,960 | $4,040 | $31,920 |
| 2018 | $1,656 | $32,720 | $4,040 | $28,680 |
| 2017 | $1,506 | $26,520 | $4,040 | $22,480 |
| 2016 | $1,465 | $25,520 | $4,040 | $21,480 |
| 2014 | $1,284 | $20,920 | $4,040 | $16,880 |
F
Landlord's Agent in 2014
Fernando Bartolomei
Vestlet Property Management
(678) 300-1781
9 Total Sales

Tenant's Agent in 2014
Glenda Broker
Non-Mls Company
(800) 289-1214
Source: Georgia MLS
MLS Number: 7307780
APN: 16-103-01-224
Disclaimer: Certain information contained herein is derived from information provided by parties other than Homes.com. All information provided is deemed reliable, but is not guaranteed to be accurate and should be independently verified.
![]() The data relating to real estate for sale on this web site comes in part from the Broker Reciprocity Program of Georgia MLS. Real estate listings held by brokerage firms other than Redfin are marked with the Broker Reciprocity logo and detailed information about them includes the name of the listing brokers. Information deemed reliable but not guaranteed. Copyright 2025 Georgia MLS. All rights reserved.
The data relating to real estate for sale on this web site comes in part from the Broker Reciprocity Program of Georgia MLS. Real estate listings held by brokerage firms other than Redfin are marked with the Broker Reciprocity logo and detailed information about them includes the name of the listing brokers. Information deemed reliable but not guaranteed. Copyright 2025 Georgia MLS. All rights reserved.