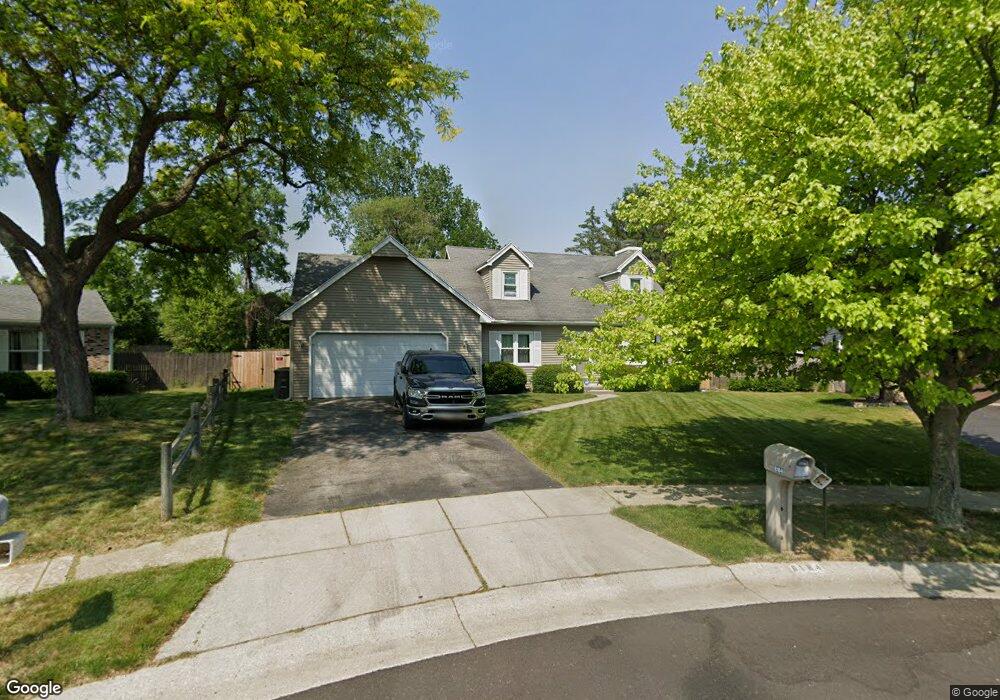
6184 Halfway Ct Toledo, OH 43612
North Towne NeighborhoodEstimated Value: $188,000 - $233,000
3
Beds
2
Baths
1,446
Sq Ft
$139/Sq Ft
Est. Value
About This Home
This home is located at 6184 Halfway Ct, Toledo, OH 43612 and is currently estimated at $200,876, approximately $138 per square foot. 6184 Halfway Ct is a home with nearby schools including Greenwood Elementary School, Washington Junior High School, and Jefferson Junior High School.
Ownership History
Date
Name
Owned For
Owner Type
Purchase Details
Closed on
Aug 26, 2022
Sold by
David And Nancy Gorman Living Trust
Bought by
David And Nancy Gorman Living Trust
Current Estimated Value
Home Financials for this Owner
Home Financials are based on the most recent Mortgage that was taken out on this home.
Original Mortgage
$111,000
Outstanding Balance
$100,847
Interest Rate
5.3%
Mortgage Type
New Conventional
Estimated Equity
$100,029
Purchase Details
Closed on
Apr 5, 2012
Sold by
Gorman David G and Gorman Nancy L
Bought by
Gorman David G and Gorman Nancy L
Purchase Details
Closed on
Oct 5, 1994
Sold by
Ratliff Robert C
Bought by
Gorman David G and Gorman Nancy L
Home Financials for this Owner
Home Financials are based on the most recent Mortgage that was taken out on this home.
Original Mortgage
$74,000
Interest Rate
7.62%
Mortgage Type
New Conventional
Create a Home Valuation Report for This Property
The Home Valuation Report is an in-depth analysis detailing your home's value as well as a comparison with similar homes in the area
Home Values in the Area
Average Home Value in this Area
Purchase History
| Date | Buyer | Sale Price | Title Company |
|---|---|---|---|
| David And Nancy Gorman Living Trust | -- | Servicelink | |
| Gorman David G | -- | Attorney | |
| Gorman David G | $92,500 | -- |
Source: Public Records
Mortgage History
| Date | Status | Borrower | Loan Amount |
|---|---|---|---|
| Open | David And Nancy Gorman Living Trust | $111,000 | |
| Previous Owner | Gorman David G | $74,000 |
Source: Public Records
Tax History Compared to Growth
Tax History
| Year | Tax Paid | Tax Assessment Tax Assessment Total Assessment is a certain percentage of the fair market value that is determined by local assessors to be the total taxable value of land and additions on the property. | Land | Improvement |
|---|---|---|---|---|
| 2024 | $1,219 | $40,075 | $8,365 | $31,710 |
| 2023 | $2,422 | $34,090 | $6,825 | $27,265 |
| 2022 | $2,413 | $34,090 | $6,825 | $27,265 |
| 2021 | $2,463 | $34,090 | $6,825 | $27,265 |
| 2020 | $2,751 | $33,110 | $6,475 | $26,635 |
| 2019 | $2,677 | $33,110 | $6,475 | $26,635 |
| 2018 | $2,481 | $33,110 | $6,475 | $26,635 |
| 2017 | $2,547 | $32,375 | $6,335 | $26,040 |
| 2016 | $2,532 | $92,500 | $18,100 | $74,400 |
| 2015 | $2,522 | $92,500 | $18,100 | $74,400 |
| 2014 | $2,206 | $32,380 | $6,340 | $26,040 |
| 2013 | $2,206 | $32,380 | $6,340 | $26,040 |
Source: Public Records
Map
Nearby Homes
- 251 Inverness Ln
- 834 Gribbin Ln
- 1322 Brooke Park Dr
- 315 Nelly
- 423 Glasgow
- 450 Glencoe
- 501 Kinloch
- 5848 Dalton Rd
- 6712 Nanafield Dr
- 6115 Benalex Dr
- 1428 Gage Rd
- 1550 Brooke Park Dr
- 1549 Brooke Park Dr
- 1601 Brooke Park Dr
- 1607 Brooke Park Dr
- 1517 Primrose Ave
- 1642 Brooke Park Dr
- 5917 Pepperell Place
- 6749 Stonegate Dr
- 265 Wallingford Rd
- 6180 Halfway Ct
- 6187 Halfway Ct
- 6185 Old Farm Ct
- 6181 Old Farm Ct
- 6176 Halfway Ct
- 6185 Halfway Ct
- 6170 Halfway Ct
- 6187 Old Farm Ct
- 6181 Halfway Ct
- 6177 Halfway Ct
- 1108 Stateline
- 1108 W State Line Rd
- 6171 Halfway Ct
- 6186 Old Farm Ct
- 6165 Old Farm Ct
- 6182 Lookover Ct
- 6165 Halfway Ct
- 6184 Lookover Ct
- 6176 Lookover Ct
- 6182 Old Farm Ct