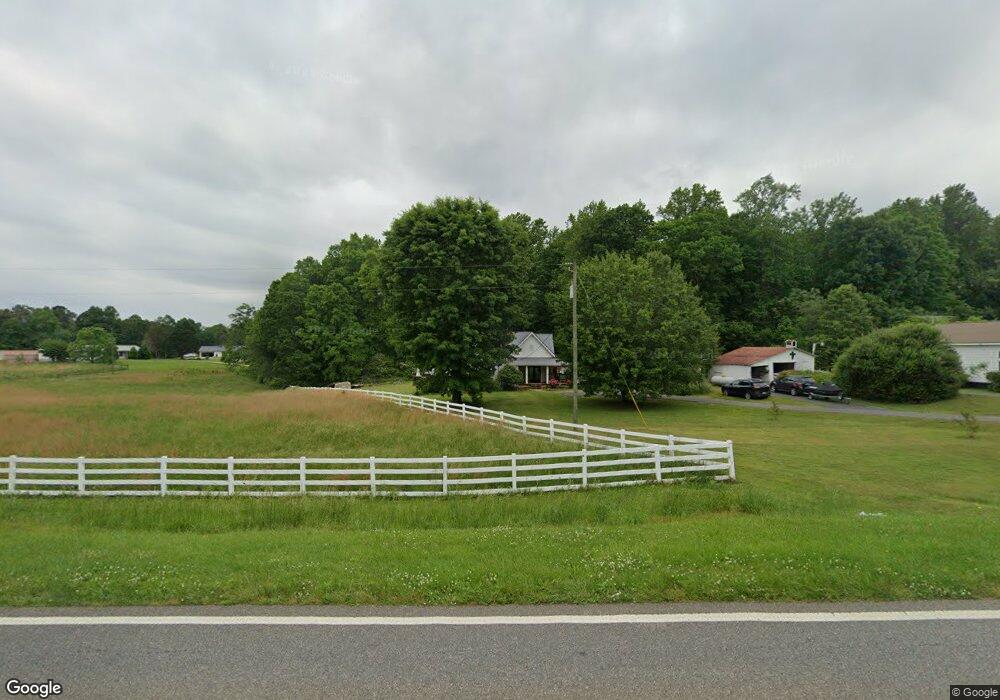
6185 Bannister Rd Cumming, GA 30028
Estimated Value: $296,000 - $471,001
3
Beds
2
Baths
2,258
Sq Ft
$174/Sq Ft
Est. Value
About This Home
This home is located at 6185 Bannister Rd, Cumming, GA 30028 and is currently estimated at $393,750, approximately $174 per square foot. 6185 Bannister Rd is a home located in Forsyth County with nearby schools including Matt Elementary School, Liberty Middle School, and North Forsyth High School.
Ownership History
Date
Name
Owned For
Owner Type
Purchase Details
Closed on
Mar 30, 2023
Sold by
Sexton Louise
Bought by
Dyer Jessica Leigh Ann and Dyer Thomas Jason
Current Estimated Value
Purchase Details
Closed on
Mar 8, 2018
Sold by
Gravitt Investments Lllp
Bought by
Dyer Jessica and Dyer Thomas
Home Financials for this Owner
Home Financials are based on the most recent Mortgage that was taken out on this home.
Original Mortgage
$165,000
Interest Rate
4.46%
Purchase Details
Closed on
Dec 28, 2016
Sold by
Leonard
Bought by
Dyer Jessica Leigh Ann and Dyer Thomas J
Home Financials for this Owner
Home Financials are based on the most recent Mortgage that was taken out on this home.
Original Mortgage
$111,600
Interest Rate
4.08%
Mortgage Type
New Conventional
Purchase Details
Closed on
Oct 24, 2013
Sold by
Sexton Leonard
Bought by
Sexton Leonard and Sexton William L
Purchase Details
Closed on
Nov 18, 1999
Sold by
Sexton Deborah A
Bought by
Sexton William L
Create a Home Valuation Report for This Property
The Home Valuation Report is an in-depth analysis detailing your home's value as well as a comparison with similar homes in the area
Home Values in the Area
Average Home Value in this Area
Purchase History
| Date | Buyer | Sale Price | Title Company |
|---|---|---|---|
| Dyer Jessica Leigh Ann | -- | -- | |
| Dyer Jessica | -- | -- | |
| Dyer Jessica Leigh Ann | $124,000 | -- | |
| Sexton Leonard | -- | -- | |
| Sexton William L | -- | -- |
Source: Public Records
Mortgage History
| Date | Status | Borrower | Loan Amount |
|---|---|---|---|
| Previous Owner | Dyer Jessica | $165,000 | |
| Previous Owner | Dyer Jessica | -- | |
| Previous Owner | Dyer Jessica Leigh Ann | $111,600 |
Source: Public Records
Tax History Compared to Growth
Tax History
| Year | Tax Paid | Tax Assessment Tax Assessment Total Assessment is a certain percentage of the fair market value that is determined by local assessors to be the total taxable value of land and additions on the property. | Land | Improvement |
|---|---|---|---|---|
| 2025 | $2,664 | $236,888 | $68,676 | $168,212 |
| 2024 | $2,664 | $138,776 | $57,448 | $81,328 |
| 2023 | $2,149 | $129,776 | $52,920 | $76,856 |
| 2022 | $2,334 | $88,020 | $33,048 | $54,972 |
| 2021 | $2,073 | $88,020 | $33,048 | $54,972 |
| 2020 | $2,013 | $85,148 | $33,048 | $52,100 |
| 2019 | $2,085 | $75,124 | $23,256 | $51,868 |
| 2018 | $1,492 | $59,492 | $23,256 | $36,236 |
| 2017 | $1,377 | $49,600 | $23,520 | $26,080 |
| 2016 | $137 | $30,944 | $14,688 | $16,256 |
| 2015 | $137 | $30,944 | $14,688 | $16,256 |
| 2014 | $121 | $29,620 | $0 | $0 |
Source: Public Records
Map
Nearby Homes
- 6245 Bannister Rd
- 6230 Bannister View Ct
- Hendricks Plan at Northbrooke
- Hillside Plan at Northbrooke
- Hedgerow Plan at Northbrooke
- Juneau Elite Plan at Northbrooke
- Ivywood Elite Plan at Northbrooke
- Holley Elite Plan at Northbrooke
- 6565 Rhett Run
- 6525 Rhett Run
- 6595 Rhett Run
- 6545 Rhett Run
- 6585 Rhett Run
- 6525 Wallace Pond Way
- 6490 Mockingbird Rd
- 6165 Namon Wallace Rd
- 6810 Wallace Creek Ct
- 6660 Wallace Farms Dr
- 6825 Wallace Creek Ct
- 5860 Bannister Rd
- 6195 Bannister Rd
- 6225 Bannister Rd
- 6200 Bannister Rd
- 6140 Bannister Rd
- 6175 Bannister Rd
- 6115 Namon Wallace Rd
- 6145 Namon Wallace Dr Unit 2
- 6145 Namon Wallace Dr
- 6145 Bannister Rd
- 6275 Bannister Rd
- 6135 Bannister Rd
- 6263 Namon Wallace Dr
- 6195 Namon Wallace Dr
- 6115 Wallace Farms Dr
- 6140 Namon Wallace Dr
- 6130 Namon Wallace Dr
- 6135 Wallace Farms Dr
- 6035 Bannister Rd
- 6620 Mockingbird Rd
- 6130 Wallace Farms Dr