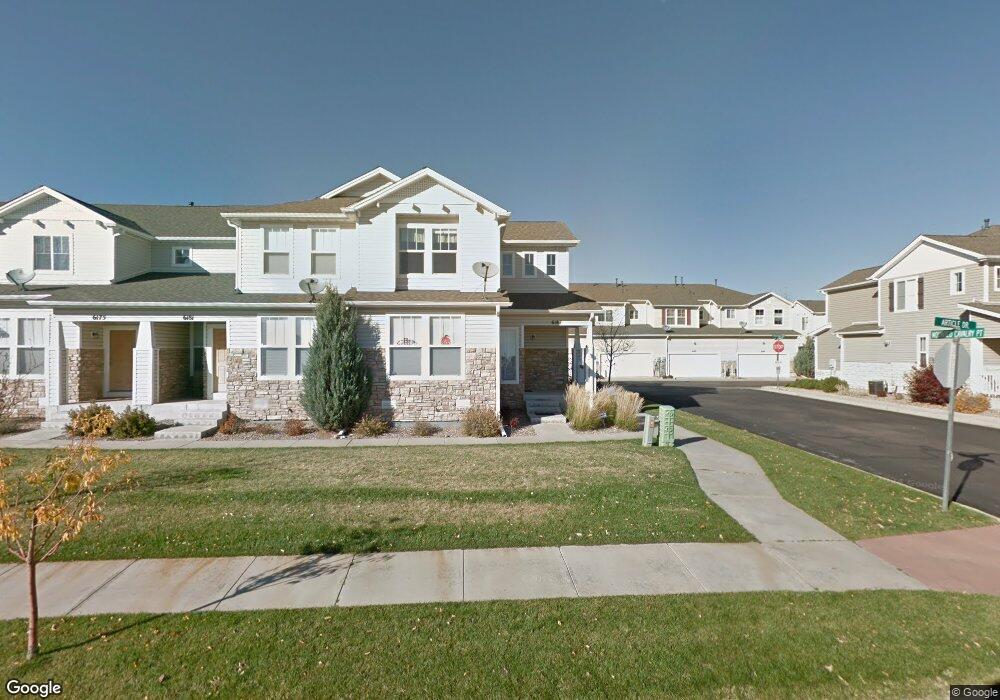
6187 Calico Patch Heights Colorado Springs, CO 80923
Ridgeview NeighborhoodEstimated Value: $342,650 - $354,000
2
Beds
3
Baths
1,625
Sq Ft
$213/Sq Ft
Est. Value
About This Home
This home is located at 6187 Calico Patch Heights, Colorado Springs, CO 80923 and is currently estimated at $345,913, approximately $212 per square foot. 6187 Calico Patch Heights is a home located in El Paso County with nearby schools including Ridgeview Elementary School, Skyview Middle School, and Vista Ridge High School.
Ownership History
Date
Name
Owned For
Owner Type
Purchase Details
Closed on
Jul 7, 2020
Sold by
Deebel Katherine and Deebel Robert
Bought by
Maese Francis L
Current Estimated Value
Home Financials for this Owner
Home Financials are based on the most recent Mortgage that was taken out on this home.
Original Mortgage
$289,976
Outstanding Balance
$257,132
Interest Rate
3.1%
Mortgage Type
VA
Estimated Equity
$88,782
Purchase Details
Closed on
Aug 16, 2016
Sold by
Deebel Katherine and Corkett Katherine
Bought by
Deebel Katherine and Deebel Robert
Home Financials for this Owner
Home Financials are based on the most recent Mortgage that was taken out on this home.
Original Mortgage
$135,000
Interest Rate
3.42%
Mortgage Type
New Conventional
Purchase Details
Closed on
Nov 23, 2004
Sold by
Pulte Home Corp
Bought by
Bourquin Timothy J and Bourquin Elizabeth E
Home Financials for this Owner
Home Financials are based on the most recent Mortgage that was taken out on this home.
Original Mortgage
$180,280
Interest Rate
5.68%
Mortgage Type
FHA
Create a Home Valuation Report for This Property
The Home Valuation Report is an in-depth analysis detailing your home's value as well as a comparison with similar homes in the area
Home Values in the Area
Average Home Value in this Area
Purchase History
| Date | Buyer | Sale Price | Title Company |
|---|---|---|---|
| Maese Francis L | $279,900 | Land Title Guarantee Company | |
| Deebel Katherine | -- | None Available | |
| Bourquin Timothy J | $182,827 | Land Title |
Source: Public Records
Mortgage History
| Date | Status | Borrower | Loan Amount |
|---|---|---|---|
| Open | Maese Francis L | $289,976 | |
| Previous Owner | Deebel Katherine | $135,000 | |
| Previous Owner | Bourquin Timothy J | $180,280 |
Source: Public Records
Tax History Compared to Growth
Tax History
| Year | Tax Paid | Tax Assessment Tax Assessment Total Assessment is a certain percentage of the fair market value that is determined by local assessors to be the total taxable value of land and additions on the property. | Land | Improvement |
|---|---|---|---|---|
| 2025 | $1,289 | $24,940 | -- | -- |
| 2024 | $1,190 | $25,640 | $4,960 | $20,680 |
| 2023 | $1,190 | $25,640 | $4,960 | $20,680 |
| 2022 | $1,080 | $18,520 | $3,200 | $15,320 |
| 2021 | $1,125 | $19,050 | $3,290 | $15,760 |
| 2020 | $963 | $16,110 | $2,400 | $13,710 |
| 2019 | $953 | $16,110 | $2,400 | $13,710 |
| 2018 | $799 | $13,250 | $1,940 | $11,310 |
| 2017 | $804 | $13,250 | $1,940 | $11,310 |
| 2016 | $811 | $13,180 | $1,910 | $11,270 |
| 2015 | $812 | $13,180 | $1,910 | $11,270 |
| 2014 | $759 | $12,090 | $1,750 | $10,340 |
Source: Public Records
Map
Nearby Homes
- 6105 New Colt Grove
- 6460 Lasso Grande Point
- 6221 Sierra Grande Point
- 6292 Riverdale Dr
- 6239 Hartman Dr
- 6330 Rockville Dr
- 6611 Alibi Cir
- 6475 Galeta Dr
- 6643 Cornelius Point
- 6653 Cornelius Point
- The Gladstone Plan at Ascent at Woodmen Heights
- The Belford Plan at Ascent at Woodmen Heights
- The Crestone Plan at Ascent at Woodmen Heights
- The Elbert Plan at Ascent at Woodmen Heights
- Blodgett Plan at Foxtail Crossing
- Herman Plan at Foxtail Crossing
- Elbert Plan at Foxtail Crossing
- 6652 Cornelius Point
- 6430 Advocate Dr
- 6085 Vallecito Dr
- 6181 Calico Patch Heights
- 6175 Calico Patch Heights
- 6169 Calico Patch Heights
- 6193 Calico Patch Heights
- 6163 Calico Patch Heights
- 6162 Calico Patch Heights
- 6168 Calico Patch Heights
- 6199 Calico Patch Heights
- 6409 Cavalry Point
- 6180 Calico Patch Heights
- 6157 Calico Patch Heights
- 6415 Cavalry Point
- 6205 Calico Patch Heights
- 6186 Calico Patch Heights
- 6421 Cavalry Point
- 6151 Calico Patch Heights
- 6211 Calico Patch Heights
- 6338 Grand Mesa Dr
- 6192 Calico Patch Heights
- 6427 Cavalry Point