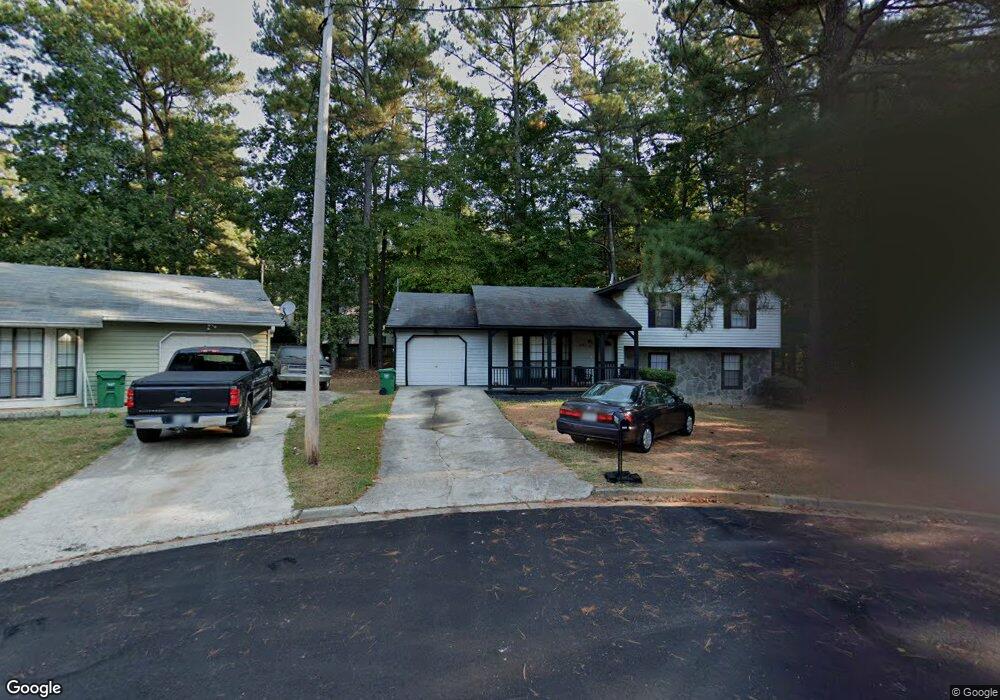
6189 Dana Ct Unit 4 Lithonia, GA 30058
Estimated Value: $206,000 - $235,000
3
Beds
2
Baths
1,786
Sq Ft
$122/Sq Ft
Est. Value
About This Home
This home is located at 6189 Dana Ct Unit 4, Lithonia, GA 30058 and is currently estimated at $218,571, approximately $122 per square foot. 6189 Dana Ct Unit 4 is a home located in DeKalb County with nearby schools including Panola Way Elementary School, Lithonia Middle School, and Lithonia High School.
Ownership History
Date
Name
Owned For
Owner Type
Purchase Details
Closed on
Sep 18, 1998
Sold by
American Investors Inc
Bought by
Banks Michael and Banks Sheila
Current Estimated Value
Home Financials for this Owner
Home Financials are based on the most recent Mortgage that was taken out on this home.
Original Mortgage
$89,366
Outstanding Balance
$18,858
Interest Rate
6.76%
Mortgage Type
FHA
Estimated Equity
$199,713
Purchase Details
Closed on
Aug 6, 1998
Sold by
Johnson Joyce L
Bought by
American Investors Inc
Home Financials for this Owner
Home Financials are based on the most recent Mortgage that was taken out on this home.
Original Mortgage
$89,366
Outstanding Balance
$18,858
Interest Rate
6.76%
Mortgage Type
FHA
Estimated Equity
$199,713
Purchase Details
Closed on
Feb 8, 1995
Sold by
Fraser Pauline A
Bought by
American Investors Inc
Home Financials for this Owner
Home Financials are based on the most recent Mortgage that was taken out on this home.
Original Mortgage
$60,463
Interest Rate
10.5%
Mortgage Type
FHA
Create a Home Valuation Report for This Property
The Home Valuation Report is an in-depth analysis detailing your home's value as well as a comparison with similar homes in the area
Home Values in the Area
Average Home Value in this Area
Purchase History
| Date | Buyer | Sale Price | Title Company |
|---|---|---|---|
| Banks Michael | $92,000 | -- | |
| American Investors Inc | $79,980 | -- | |
| American Investors Inc | $13,500 | -- |
Source: Public Records
Mortgage History
| Date | Status | Borrower | Loan Amount |
|---|---|---|---|
| Open | Banks Michael | $89,366 | |
| Previous Owner | American Investors Inc | $60,463 |
Source: Public Records
Tax History Compared to Growth
Tax History
| Year | Tax Paid | Tax Assessment Tax Assessment Total Assessment is a certain percentage of the fair market value that is determined by local assessors to be the total taxable value of land and additions on the property. | Land | Improvement |
|---|---|---|---|---|
| 2025 | $2,740 | $83,320 | $15,000 | $68,320 |
| 2024 | $3,102 | $90,600 | $15,000 | $75,600 |
| 2023 | $3,102 | $87,200 | $15,000 | $72,200 |
| 2022 | $2,589 | $77,160 | $15,000 | $62,160 |
| 2021 | $1,684 | $50,880 | $4,040 | $46,840 |
| 2020 | $1,460 | $44,240 | $4,040 | $40,200 |
| 2019 | $1,250 | $38,480 | $4,040 | $34,440 |
| 2018 | $1,074 | $37,720 | $4,040 | $33,680 |
| 2017 | $1,029 | $31,160 | $4,040 | $27,120 |
| 2016 | $952 | $29,600 | $4,040 | $25,560 |
| 2014 | $720 | $22,720 | $4,040 | $18,680 |
Source: Public Records
Map
Nearby Homes
- 6185 Marbut Farms Chase
- 6248 Marbut Farms Ln
- 2293 Cherokee Valley Dr Unit 3
- 6202 Saint Christophers Ct
- 2360 Anne's Lake Cir
- 2211 Jonathan Ave
- 2216 Marbut Farms Trace
- 6182 Saint Charles Ct
- 6260 Marbut Farms Terrace
- 2247 Cherokee Valley Dr
- 2285 Cherokee Valley Cir Unit III
- 6248 Creekford Ln
- 1882 Corners Cir
- 6315 Noreen Way
- 6268 Creekford Ln
- 6126 Marbut Rd Unit II
- 6255 Creekford Ln Unit 4
- 2191 Phillips Rd
- 6300 Creekford Ln
- 6175 Creekford Dr
- 6194 Hyde Park Ln
- 6196 Dana Ct
- 6183 Dana Ct Unit 4
- 6186 Hyde Park Ln
- 6198 Hyde Park Ln
- 6182 Hyde Park Ln
- 6192 Dana Ct
- 6221 Marbut Farms Ln
- 6199 Hyde Park Ln
- 6186 Dana Ct
- 6219 Marbut Farms Chase
- 6180 Dana Ct Unit 4
- 6223 Marbut Farms Ln
- 6173 Dana Ct
- 6209 Marbut Farms Chase
- 6172 Hyde Park Ln
- 6185 Hyde Park Ln
- 6193 Hyde Park Ln
- 6181 Hyde Park Ln Unit 4
- 6169 Dana Ct