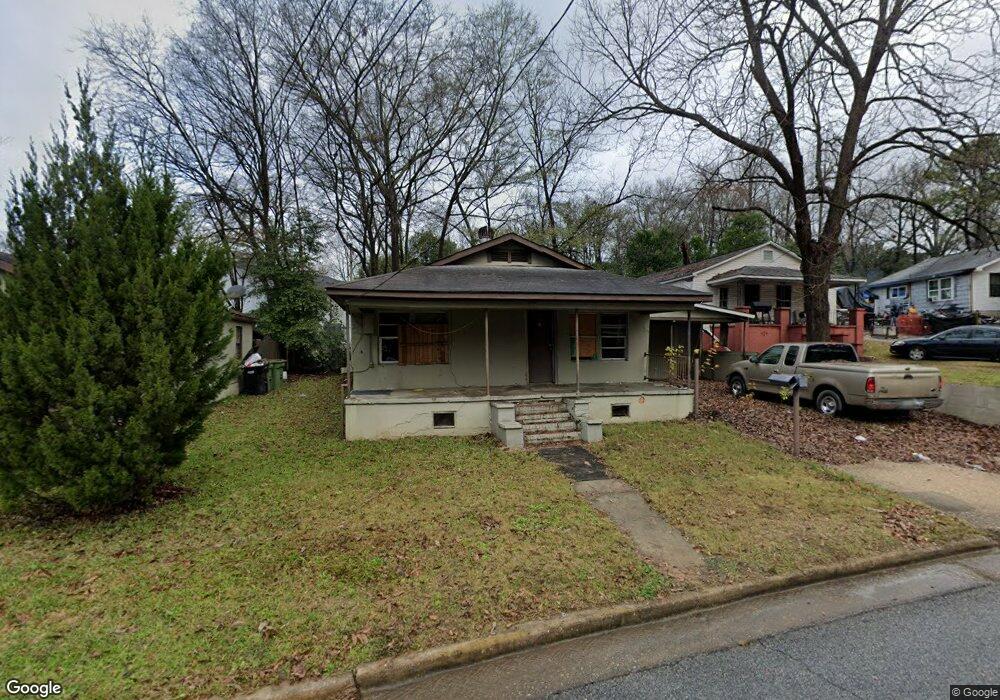
619 44th St Columbus, GA 31904
North Highlands NeighborhoodEstimated Value: $78,000 - $144,000
4
Beds
4
Baths
1,776
Sq Ft
$65/Sq Ft
Est. Value
About This Home
This home is located at 619 44th St, Columbus, GA 31904 and is currently estimated at $115,511, approximately $65 per square foot. 619 44th St is a home located in Muscogee County with nearby schools including Fox Elementary School, Arnold Middle School, and Jordan Vocational High School.
Ownership History
Date
Name
Owned For
Owner Type
Purchase Details
Closed on
Mar 18, 2019
Sold by
Mariella Enterprises Llc
Bought by
Cozbey Rick
Current Estimated Value
Home Financials for this Owner
Home Financials are based on the most recent Mortgage that was taken out on this home.
Original Mortgage
$34,000
Interest Rate
4.3%
Mortgage Type
New Conventional
Purchase Details
Closed on
Feb 27, 2014
Sold by
Petrivelli Leanna
Bought by
Mariella Enterprises Llc
Purchase Details
Closed on
Oct 14, 2013
Sold by
Wc Pc Llc
Bought by
Petrivelli Leanna and Caronna Salvatore
Purchase Details
Closed on
Sep 6, 2013
Sold by
Bishop Carrie L
Bought by
Wc Pc Llc
Purchase Details
Closed on
Jul 17, 2013
Sold by
Columbus Area Habitat For
Bought by
Bishop Carrie L
Purchase Details
Closed on
Jan 25, 2013
Sold by
Us Bank National Associati
Bought by
Columbus Are Habitat For Human
Purchase Details
Closed on
May 1, 2012
Sold by
Mcgarr Troy
Bought by
Us Bank National Association T
Create a Home Valuation Report for This Property
The Home Valuation Report is an in-depth analysis detailing your home's value as well as a comparison with similar homes in the area
Home Values in the Area
Average Home Value in this Area
Purchase History
| Date | Buyer | Sale Price | Title Company |
|---|---|---|---|
| Cozbey Rick | $40,000 | -- | |
| Mariella Enterprises Llc | -- | -- | |
| Petrivelli Leanna | $14,500 | -- | |
| Wc Pc Llc | $9,500 | -- | |
| Bishop Carrie L | -- | -- | |
| Columbus Are Habitat For Human | -- | -- | |
| Us Bank National Association T | -- | -- |
Source: Public Records
Mortgage History
| Date | Status | Borrower | Loan Amount |
|---|---|---|---|
| Closed | Cozbey Rick | $34,000 |
Source: Public Records
Tax History
| Year | Tax Paid | Tax Assessment Tax Assessment Total Assessment is a certain percentage of the fair market value that is determined by local assessors to be the total taxable value of land and additions on the property. | Land | Improvement |
|---|---|---|---|---|
| 2025 | $5,275 | $41,972 | $4,632 | $37,340 |
| 2024 | $3,615 | $41,972 | $4,632 | $37,340 |
| 2023 | $1,653 | $41,972 | $4,632 | $37,340 |
| 2022 | $1,026 | $25,128 | $3,244 | $21,884 |
| 2021 | $984 | $24,004 | $3,244 | $20,760 |
| 2020 | $653 | $16,000 | $2,800 | $13,200 |
| 2019 | $922 | $22,508 | $3,244 | $19,264 |
| 2018 | $922 | $22,508 | $3,244 | $19,264 |
| 2017 | $925 | $22,508 | $3,244 | $19,264 |
| 2016 | $349 | $8,457 | $1,246 | $7,211 |
| 2015 | $349 | $8,457 | $1,246 | $7,211 |
| 2014 | $240 | $5,800 | $1,246 | $4,554 |
| 2013 | -- | $14,095 | $1,246 | $12,849 |
Source: Public Records
Map
Nearby Homes
Your Personal Tour Guide
Ask me questions while you tour the home.