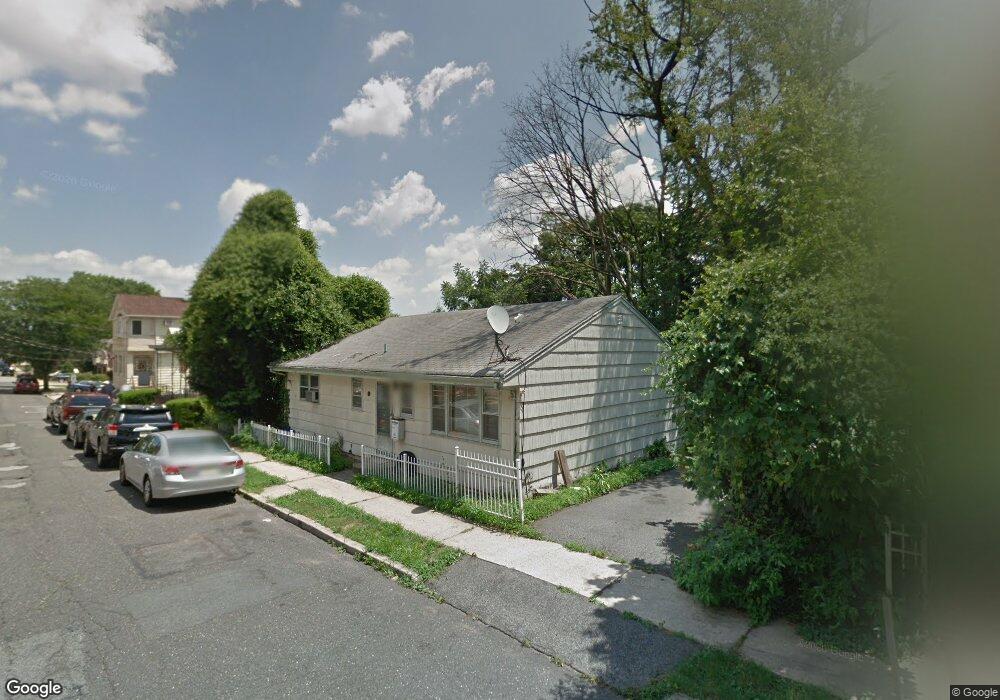
619 5th St Carlstadt, NJ 07072
Estimated Value: $880,239 - $929,000
--
Bed
--
Bath
2,296
Sq Ft
$393/Sq Ft
Est. Value
About This Home
This home is located at 619 5th St, Carlstadt, NJ 07072 and is currently estimated at $902,560, approximately $393 per square foot. 619 5th St is a home located in Bergen County with nearby schools including Carlstadt Public School, Henry P Becton Regional High School, and Montessori School of East Rutherford.
Ownership History
Date
Name
Owned For
Owner Type
Purchase Details
Closed on
Nov 24, 2015
Sold by
Ultimate Investment Llc
Bought by
Pillai Rajkumar R and Patel Zhankhana M
Current Estimated Value
Home Financials for this Owner
Home Financials are based on the most recent Mortgage that was taken out on this home.
Original Mortgage
$518,925
Interest Rate
3.79%
Mortgage Type
FHA
Purchase Details
Closed on
Jun 26, 2014
Sold by
Hsbc Bank Usa Na
Bought by
Ultimate Investments Llc
Home Financials for this Owner
Home Financials are based on the most recent Mortgage that was taken out on this home.
Original Mortgage
$205,000
Interest Rate
4.18%
Mortgage Type
Unknown
Purchase Details
Closed on
Jul 22, 2013
Sold by
Saudino Michael
Bought by
Hsbc Bank Usa National Association As I
Purchase Details
Closed on
Apr 10, 2002
Sold by
Norling Stephen C
Bought by
Norling Michael H
Create a Home Valuation Report for This Property
The Home Valuation Report is an in-depth analysis detailing your home's value as well as a comparison with similar homes in the area
Home Values in the Area
Average Home Value in this Area
Purchase History
| Date | Buyer | Sale Price | Title Company |
|---|---|---|---|
| Pillai Rajkumar R | $550,000 | Prestige Title Agency Inc | |
| Ultimate Investments Llc | $205,000 | -- | |
| Hsbc Bank Usa National Association As I | -- | -- | |
| Norling Michael H | $187,000 | -- |
Source: Public Records
Mortgage History
| Date | Status | Borrower | Loan Amount |
|---|---|---|---|
| Previous Owner | Pillai Rajkumar R | $518,925 | |
| Previous Owner | Ultimate Investments Llc | $205,000 |
Source: Public Records
Tax History Compared to Growth
Tax History
| Year | Tax Paid | Tax Assessment Tax Assessment Total Assessment is a certain percentage of the fair market value that is determined by local assessors to be the total taxable value of land and additions on the property. | Land | Improvement |
|---|---|---|---|---|
| 2025 | $11,883 | $741,600 | $260,600 | $481,000 |
| 2024 | $10,862 | $715,400 | $248,100 | $467,300 |
| 2023 | $10,508 | $660,300 | $220,600 | $439,700 |
| 2022 | $10,508 | $622,500 | $202,500 | $420,000 |
| 2021 | $10,749 | $592,900 | $190,000 | $402,900 |
| 2020 | $10,323 | $581,600 | $185,000 | $396,600 |
| 2019 | $10,511 | $572,800 | $182,500 | $390,300 |
| 2018 | $10,554 | $549,100 | $180,000 | $369,100 |
| 2017 | $10,300 | $540,400 | $177,500 | $362,900 |
| 2016 | $6,752 | $317,600 | $250,000 | $67,600 |
| 2015 | $6,574 | $317,600 | $250,000 | $67,600 |
| 2014 | $6,323 | $317,600 | $250,000 | $67,600 |
Source: Public Records
Map
Nearby Homes
- 340 Marsan Dr
- 38 Hackensack St
- 30 Humboldt St
- 522 9th St
- 53 Hackensack St
- 88 Columbia St
- 426 Broad St
- 344 10th St
- 89 Rose St
- 451 Hoboken Rd
- 573 Anderson Ave
- 148 Hackensack St
- 507 Washington St
- 327 Madison St
- 165 Madison St
- 167 Columbia St
- 409 Washington St
- 176 Hackensack St Unit 6
- 592 Central Ave
- 206 Columbia St