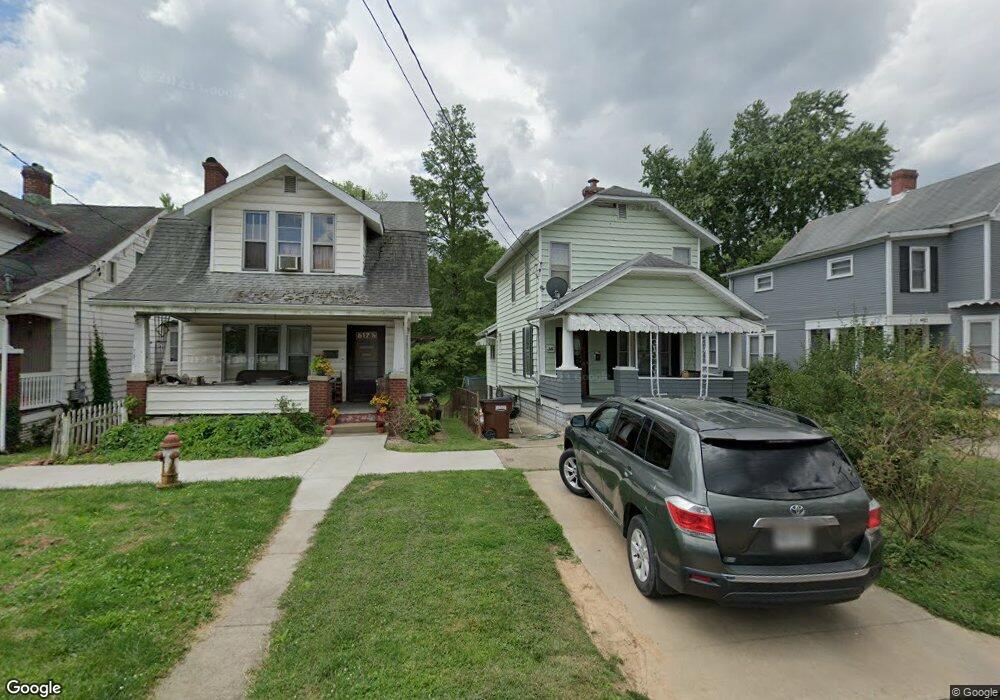
619 8th St Marietta, OH 45750
Estimated Value: $101,006 - $119,000
2
Beds
2
Baths
1,116
Sq Ft
$100/Sq Ft
Est. Value
About This Home
This home is located at 619 8th St, Marietta, OH 45750 and is currently estimated at $111,502, approximately $99 per square foot. 619 8th St is a home located in Washington County with nearby schools including Marietta High School, St. Mary Catholic School, and Veritas Classical Academy.
Ownership History
Date
Name
Owned For
Owner Type
Purchase Details
Closed on
Jul 10, 2024
Sold by
Graham Amy S and Bean Thomas D
Bought by
Bean Thomas D and Bean Amy S
Current Estimated Value
Home Financials for this Owner
Home Financials are based on the most recent Mortgage that was taken out on this home.
Original Mortgage
$67,200
Outstanding Balance
$66,391
Interest Rate
6.95%
Mortgage Type
New Conventional
Estimated Equity
$45,111
Purchase Details
Closed on
Jun 30, 2010
Sold by
Maddox James R and Maddox Esther A
Bought by
Bean Amy S and Graham Amy S
Home Financials for this Owner
Home Financials are based on the most recent Mortgage that was taken out on this home.
Original Mortgage
$61,200
Interest Rate
4.23%
Mortgage Type
Credit Line Revolving
Purchase Details
Closed on
Oct 31, 2003
Bought by
Maddox James R
Purchase Details
Closed on
Nov 7, 2000
Bought by
Maddox James R and Maddox Esther
Create a Home Valuation Report for This Property
The Home Valuation Report is an in-depth analysis detailing your home's value as well as a comparison with similar homes in the area
Home Values in the Area
Average Home Value in this Area
Purchase History
| Date | Buyer | Sale Price | Title Company |
|---|---|---|---|
| Bean Thomas D | -- | None Listed On Document | |
| Bean Thomas D | -- | None Listed On Document | |
| Bean Amy S | -- | None Available | |
| Maddox James R | -- | -- | |
| Maddox James R | -- | -- |
Source: Public Records
Mortgage History
| Date | Status | Borrower | Loan Amount |
|---|---|---|---|
| Open | Bean Thomas D | $67,200 | |
| Closed | Bean Thomas D | $67,200 | |
| Previous Owner | Bean Amy S | $61,200 |
Source: Public Records
Tax History Compared to Growth
Tax History
| Year | Tax Paid | Tax Assessment Tax Assessment Total Assessment is a certain percentage of the fair market value that is determined by local assessors to be the total taxable value of land and additions on the property. | Land | Improvement |
|---|---|---|---|---|
| 2024 | $674 | $19,890 | $6,060 | $13,830 |
| 2023 | $674 | $19,890 | $6,060 | $13,830 |
| 2022 | $667 | $19,890 | $6,060 | $13,830 |
| 2021 | $804 | $22,720 | $5,310 | $17,410 |
| 2020 | $808 | $22,720 | $5,310 | $17,410 |
| 2019 | $806 | $22,720 | $5,310 | $17,410 |
| 2018 | $750 | $20,540 | $4,610 | $15,930 |
| 2017 | $748 | $20,540 | $4,610 | $15,930 |
| 2016 | $747 | $20,540 | $4,610 | $15,930 |
| 2015 | $687 | $18,030 | $4,750 | $13,280 |
| 2014 | $1,159 | $18,030 | $4,750 | $13,280 |
| 2013 | $688 | $18,030 | $4,750 | $13,280 |
Source: Public Records
Map
Nearby Homes