619 Ann St Oceanside, CA 92057
North Valley NeighborhoodEstimated Value: $718,000 - $792,000
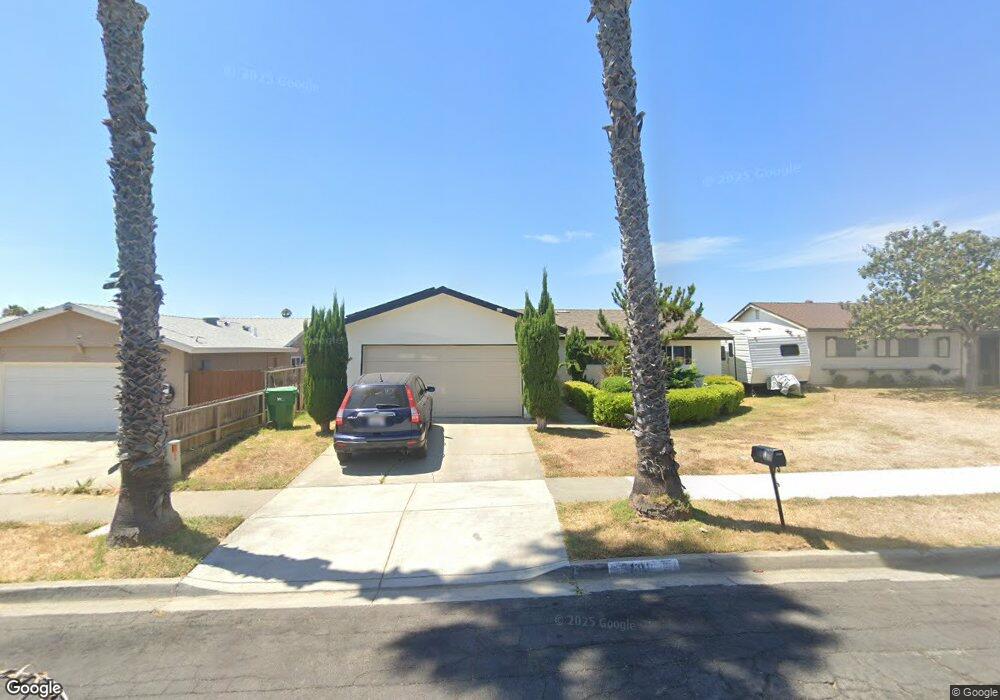
About This Home
This home is located at 619 Ann St, Oceanside, CA 92057 and is currently estimated at $760,106, approximately $621 per square foot. 619 Ann St is a home located in San Diego County with nearby schools including Libby Elementary School, Cesar Chavez Middle School, and El Camino High School.
Ownership History
We collect this data history from publicly available records. To have your information removed, we recommend requesting removal directly through your county’s website.
Purchase Details
Home Financials for this Owner
Home Financials are based on the most recent Mortgage that was taken out on this home.Home Values in the Area
Average Home Value in this Area
Purchase History
We collect this data history from publicly available records. To have your information removed, we recommend requesting removal directly through your county’s website.
| Date | Buyer | Sale Price | Title Company |
|---|---|---|---|
| -- | Lawyers Title |
Mortgage History
We collect this data history from publicly available records. To have your information removed, we recommend requesting removal directly through your county’s website.
| Date | Status | Borrower | Loan Amount |
|---|---|---|---|
| Closed | $100,000 |
Tax History
We collect this data history from publicly available records. To have your information removed, we recommend requesting removal directly through your county’s website.
| Year | Tax Paid | Tax Assessment Tax Assessment Total Assessment is a certain percentage of the fair market value that is determined by local assessors to be the total taxable value of land and additions on the property. | Land | Improvement |
|---|---|---|---|---|
| 2025 | $789 | $74,429 | $18,448 | $55,981 |
| 2024 | $789 | $72,971 | $18,087 | $54,884 |
| 2023 | $763 | $71,541 | $17,733 | $53,808 |
| 2022 | $750 | $70,139 | $17,386 | $52,753 |
| 2021 | $751 | $68,765 | $17,046 | $51,719 |
| 2020 | $728 | $68,061 | $16,872 | $51,189 |
| 2019 | $707 | $66,728 | $16,542 | $50,186 |
| 2018 | $698 | $65,420 | $16,218 | $49,202 |
| 2017 | $70 | $64,138 | $15,900 | $48,238 |
| 2016 | $660 | $62,882 | $15,589 | $47,293 |
| 2015 | $641 | $61,938 | $15,355 | $46,583 |
| 2014 | $617 | $60,726 | $15,055 | $45,671 |
Map
- 656 Roja St
- 4969 Stephanie Place
- 4908 Concho Place
- 635 Michael St
- 569 Gold Dr
- 656 Parker St
- 4795 Claire Dr
- 4999 Macario Dr
- 4893 Merida Way
- 671 Parker St
- 4873 Merida Way
- 672 Arthur Ave
- 4901 Tropea St Unit II
- 5004 Los Morros Way Unit 2
- 5021 Los Morros Way Unit 31
- 5037 Los Morros Way Unit 70
- 5034 Los Morros Way Unit 62
- 905 Glendora Dr
- 5146 E Parker St
- 150 N River Cir Unit 105
Ask me questions while you tour the home.