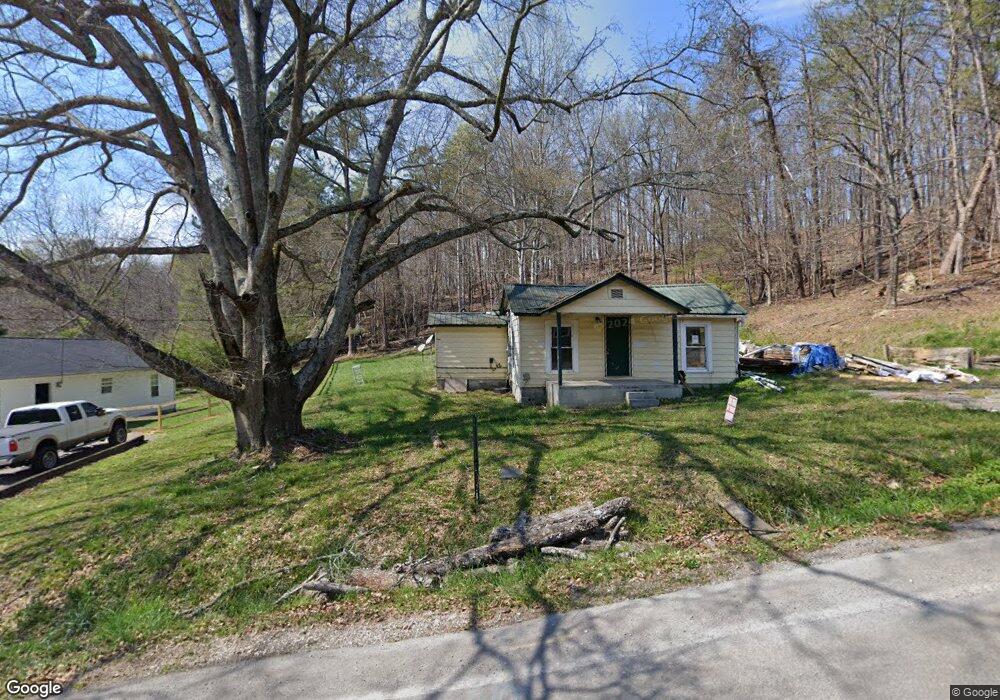
619 Bradley Ave La Fayette, GA 30728
Estimated Value: $157,773 - $184,000
3
Beds
1
Bath
1,220
Sq Ft
$138/Sq Ft
Est. Value
About This Home
This home is located at 619 Bradley Ave, La Fayette, GA 30728 and is currently estimated at $168,443, approximately $138 per square foot. 619 Bradley Ave is a home located in Walker County with nearby schools including North Lafayette Elementary School, Lafayette Middle School, and Lafayette High School.
Ownership History
Date
Name
Owned For
Owner Type
Purchase Details
Closed on
Jan 21, 2021
Sold by
American Ira Llc Fbo
Bought by
Shropshire Justin
Current Estimated Value
Purchase Details
Closed on
Mar 8, 2011
Sold by
Federal National Mortgage Association
Bought by
Hyc Financial Llc
Purchase Details
Closed on
Jul 6, 2010
Sold by
Bac Home Loans Servicing L
Bought by
Federal National Mtg Associati
Purchase Details
Closed on
May 18, 2007
Sold by
Not Provided
Bought by
Hyc Financial Llc
Purchase Details
Closed on
Nov 10, 2005
Sold by
Not Provided
Bought by
Hyc Financial Llc
Purchase Details
Closed on
Apr 28, 2003
Sold by
Lee William W and Lee Florence L
Bought by
Pell Holbert L
Purchase Details
Closed on
Feb 15, 2000
Sold by
Broadrick Lester E and Broadrick Betty
Bought by
Lee William W and Lee Florence L
Purchase Details
Closed on
Apr 19, 1984
Sold by
Frazier Charles
Bought by
Broadrick Lester E and Broadrick Betty
Purchase Details
Closed on
Feb 26, 1973
Sold by
Lee William W
Bought by
Frazier Charles
Purchase Details
Closed on
Mar 30, 1971
Bought by
Lee William W
Create a Home Valuation Report for This Property
The Home Valuation Report is an in-depth analysis detailing your home's value as well as a comparison with similar homes in the area
Home Values in the Area
Average Home Value in this Area
Purchase History
| Date | Buyer | Sale Price | Title Company |
|---|---|---|---|
| Shropshire Justin | $15,000 | -- | |
| Hyc Financial Llc | $4,000 | -- | |
| Federal National Mtg Associati | $46,164 | -- | |
| Bac Home Loans Servicing Lp | $46,164 | -- | |
| Hyc Financial Llc | $52,000 | -- | |
| Hyc Financial Llc | -- | -- | |
| Pell Holbert L | $28,000 | -- | |
| Lee William W | $21,500 | -- | |
| Broadrick Lester E | -- | -- | |
| Frazier Charles | -- | -- | |
| Lee William W | -- | -- |
Source: Public Records
Tax History Compared to Growth
Tax History
| Year | Tax Paid | Tax Assessment Tax Assessment Total Assessment is a certain percentage of the fair market value that is determined by local assessors to be the total taxable value of land and additions on the property. | Land | Improvement |
|---|---|---|---|---|
| 2024 | $890 | $37,390 | $9,483 | $27,907 |
| 2023 | $833 | $33,921 | $7,526 | $26,395 |
| 2022 | $158 | $25,496 | $3,183 | $22,313 |
| 2021 | $644 | $21,945 | $3,183 | $18,762 |
| 2020 | $560 | $18,261 | $3,183 | $15,078 |
| 2019 | $561 | $18,261 | $3,183 | $15,078 |
| 2018 | $543 | $18,261 | $3,183 | $15,078 |
| 2017 | $543 | $18,261 | $3,183 | $15,078 |
| 2016 | $503 | $18,261 | $3,183 | $15,078 |
| 2015 | $568 | $19,625 | $4,884 | $14,741 |
| 2014 | $473 | $16,986 | $4,884 | $12,102 |
| 2013 | -- | $16,985 | $4,884 | $12,101 |
Source: Public Records
Map
Nearby Homes
- 608 Bradley Ave
- 1106 N Chattanooga St
- 0 N Chattanooga St
- 911 N Chattanooga St
- 1 & 3 N High St
- 0 Fortune St Unit 1520483
- 3 Fortune St
- 212 S High St
- 0 Probasco St N Unit 1503555
- 204 S High St
- 1876 Old Mineral Springs Rd
- 0 Walnut St Unit 1522902
- 307 Park St
- 0 Center St Unit 15 11492953
- 0 Center St Unit 16 11493665
- 0 Center St Unit 1517720
- 113 Ann St
- 307 Ridgecrest Dr
- 206 Glenn St
- 205 Cavender St
- 617 Bradley Ave
- 620 Bradley Ave
- 615 Bradley Ave
- 613 Bradley Ave
- 653 Bradley Ave
- 55 Enloe St
- 611 Bradley Ave
- 51 Enloe St
- 610 Bradley Ave
- 713 Bradley Ave
- 715 Bradley Ave
- 3 Bradley Ave
- 1 Bradley Ave
- 708 Bradley Ave
- 603 Bradley Ave
- 709 Bradley Ave
- 711 Bradley Ave
- 602 Bradley Ave
- 509 Bradley Ave
- 721 Bradley Ave