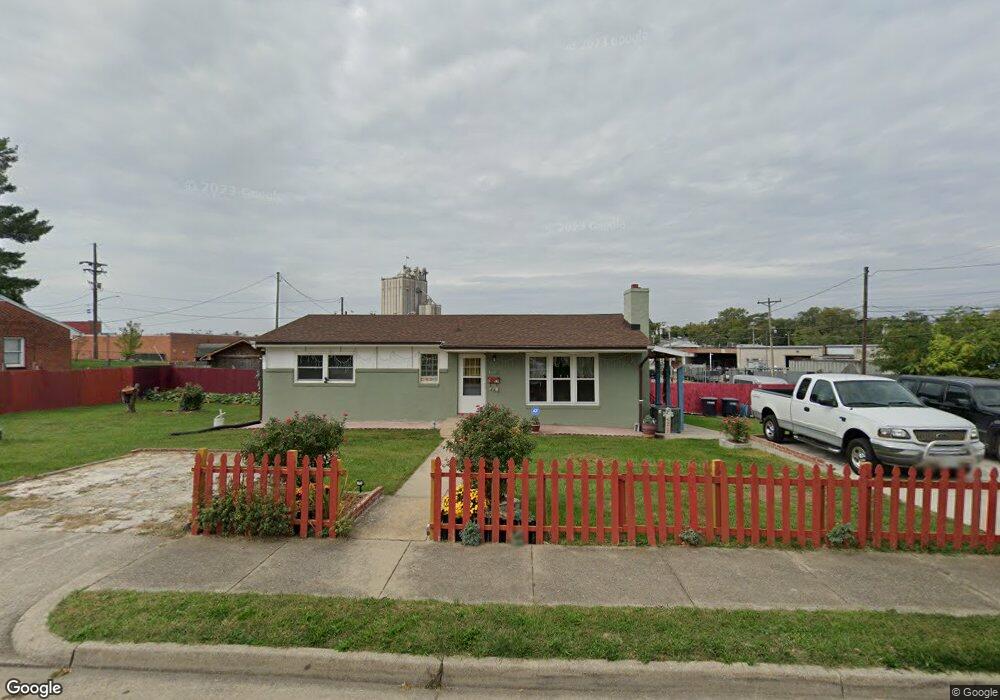
619 Broad St Harrisonburg, VA 22802
Northeast Harrisonburg NeighborhoodEstimated Value: $254,000 - $276,318
3
Beds
2
Baths
1,247
Sq Ft
$213/Sq Ft
Est. Value
About This Home
This home is located at 619 Broad St, Harrisonburg, VA 22802 and is currently estimated at $265,580, approximately $212 per square foot. 619 Broad St is a home located in Harrisonburg City with nearby schools including Spotswood Elementary School, Skyline Middle School, and Harrisonburg High School.
Ownership History
Date
Name
Owned For
Owner Type
Purchase Details
Closed on
Nov 13, 2017
Sold by
Alas Alfaro Blanca L and Blanco Blanca Alas
Bought by
Alas Alfaro Blanca L
Current Estimated Value
Home Financials for this Owner
Home Financials are based on the most recent Mortgage that was taken out on this home.
Original Mortgage
$145,500
Interest Rate
3.9%
Mortgage Type
New Conventional
Create a Home Valuation Report for This Property
The Home Valuation Report is an in-depth analysis detailing your home's value as well as a comparison with similar homes in the area
Home Values in the Area
Average Home Value in this Area
Purchase History
| Date | Buyer | Sale Price | Title Company |
|---|---|---|---|
| Alas Alfaro Blanca L | -- | Main Street Title Group Llc |
Source: Public Records
Mortgage History
| Date | Status | Borrower | Loan Amount |
|---|---|---|---|
| Closed | Alas Alfaro Blanca L | $145,500 |
Source: Public Records
Tax History
| Year | Tax Paid | Tax Assessment Tax Assessment Total Assessment is a certain percentage of the fair market value that is determined by local assessors to be the total taxable value of land and additions on the property. | Land | Improvement |
|---|---|---|---|---|
| 2025 | $2,336 | $241,000 | $55,000 | $186,000 |
| 2024 | $2,336 | $231,300 | $48,300 | $183,000 |
| 2023 | $2,117 | $220,500 | $46,000 | $174,500 |
| 2022 | $1,735 | $186,600 | $42,000 | $144,600 |
| 2021 | $1,503 | $167,000 | $40,000 | $127,000 |
| 2020 | $1,326 | $150,000 | $40,000 | $110,000 |
| 2019 | $1,318 | $149,100 | $40,000 | $109,100 |
| 2018 | $1,020 | $147,500 | $40,000 | $107,500 |
| 2017 | $1,020 | $138,800 | $40,000 | $98,800 |
| 2016 | $1,020 | $141,600 | $40,000 | $101,600 |
| 2015 | $1,020 | $141,600 | $40,000 | $101,600 |
| 2014 | -- | $145,800 | $40,000 | $105,800 |
Source: Public Records
Map
Nearby Homes
Your Personal Tour Guide
Ask me questions while you tour the home.