Estimated Value: $172,000 - $183,000
3
Beds
1
Bath
962
Sq Ft
$184/Sq Ft
Est. Value
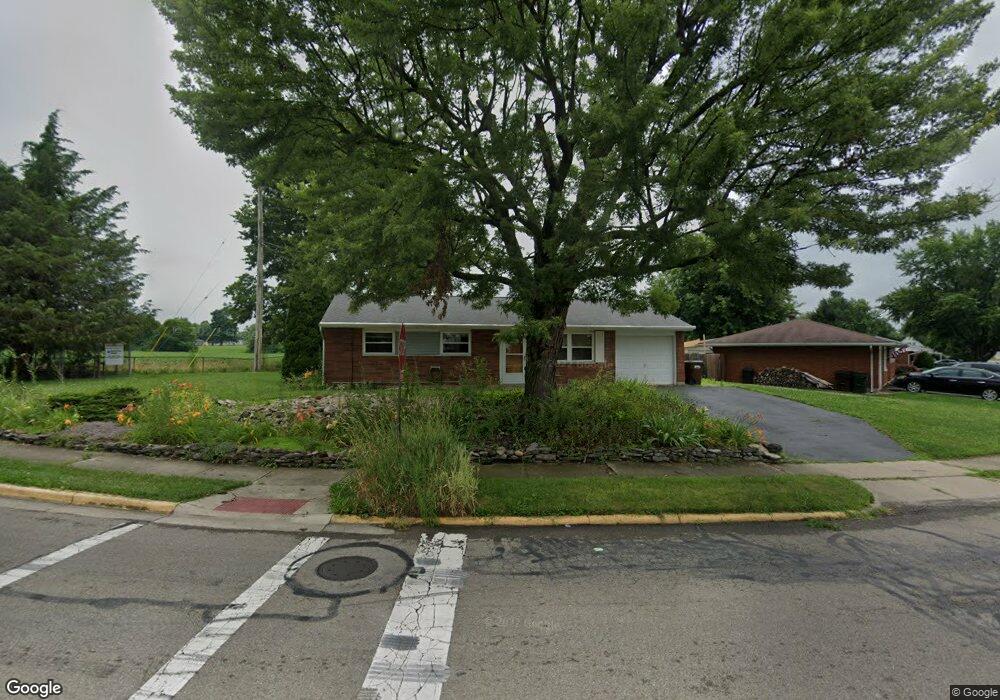
About This Home
This home is located at 619 Buckskin Trail, Xenia, OH 45385 and is currently estimated at $177,280, approximately $184 per square foot. 619 Buckskin Trail is a home located in Greene County with nearby schools including Xenia High School, Summit Academy Community School for Alternative Learners - Xenia, and Legacy Christian Academy.
Ownership History
Date
Name
Owned For
Owner Type
Purchase Details
Closed on
Apr 28, 2021
Sold by
Dixon Joan R
Bought by
Morrow Kaitlyn
Current Estimated Value
Home Financials for this Owner
Home Financials are based on the most recent Mortgage that was taken out on this home.
Original Mortgage
$121,250
Outstanding Balance
$109,883
Interest Rate
3.1%
Mortgage Type
New Conventional
Estimated Equity
$67,397
Purchase Details
Closed on
Sep 2, 2005
Sold by
Kettering Eugene Lee
Bought by
Dixon Joan R
Home Financials for this Owner
Home Financials are based on the most recent Mortgage that was taken out on this home.
Original Mortgage
$68,000
Interest Rate
5.93%
Mortgage Type
Fannie Mae Freddie Mac
Purchase Details
Closed on
Nov 16, 1998
Sold by
Dixon Joan R
Bought by
Dixon Joan R and Kettering Eugene Lee
Purchase Details
Closed on
Apr 12, 1994
Bought by
Dixon Joan R
Create a Home Valuation Report for This Property
The Home Valuation Report is an in-depth analysis detailing your home's value as well as a comparison with similar homes in the area
Home Values in the Area
Average Home Value in this Area
Purchase History
| Date | Buyer | Sale Price | Title Company |
|---|---|---|---|
| Morrow Kaitlyn | $125,000 | Chicago Title Company Llc | |
| Dixon Joan R | -- | -- | |
| Dixon Joan R | -- | -- | |
| Dixon Joan R | $53,000 | -- |
Source: Public Records
Mortgage History
| Date | Status | Borrower | Loan Amount |
|---|---|---|---|
| Open | Morrow Kaitlyn | $121,250 | |
| Previous Owner | Dixon Joan R | $68,000 |
Source: Public Records
Tax History Compared to Growth
Tax History
| Year | Tax Paid | Tax Assessment Tax Assessment Total Assessment is a certain percentage of the fair market value that is determined by local assessors to be the total taxable value of land and additions on the property. | Land | Improvement |
|---|---|---|---|---|
| 2024 | $1,805 | $43,300 | $10,570 | $32,730 |
| 2023 | $1,805 | $43,300 | $10,570 | $32,730 |
| 2022 | $1,496 | $30,600 | $6,220 | $24,380 |
| 2021 | $1,036 | $29,660 | $6,220 | $23,440 |
| 2020 | $992 | $29,660 | $6,220 | $23,440 |
| 2019 | $726 | $23,150 | $6,620 | $16,530 |
| 2018 | $729 | $23,150 | $6,620 | $16,530 |
| 2017 | $617 | $23,150 | $6,620 | $16,530 |
| 2016 | $617 | $20,730 | $6,620 | $14,110 |
| 2015 | $619 | $20,730 | $6,620 | $14,110 |
| 2014 | $592 | $20,730 | $6,620 | $14,110 |
Source: Public Records
Map
Nearby Homes
- 1144 Rockwell Dr
- 1208 Bellbrook Ave
- 1342 Kylemore Dr
- 1272 Bellbrook Ave
- 1618 Navajo Dr
- 1568 Cheyenne Dr
- 1778 Arapaho Dr
- 1283 June Dr
- 1391 June Dr
- 1233 June Dr
- 1223 June Dr
- 1653 Seneca Dr
- 121 S Progress Dr
- 1769 Gayhart Dr
- 1829 Gayhart Dr
- 2758 Wyoming Dr
- 1866 Roxbury Dr
- 305-325 Bellbrook Ave
- 343 Sheelin Rd
- 1351 Omard Dr
- 641 Buckskin Trail
- 655 Buckskin Trail
- 628 Buckskin Trail
- 638 Buckskin Trail
- 667 Buckskin Trail
- 1116 Rockwell Dr
- 802 Tomahawk Trail
- 664 Buckskin Trail
- 679 Buckskin Trail
- 678 Buckskin Trail
- 814 Tomahawk Trail
- 1128 Rockwell Dr
- 693 Buckskin Trail
- 807 Tomahawk Trail
- 690 Buckskin Trail
- 828 Tomahawk Trail
- 707 Buckskin Trail
- 821 Tomahawk Trail
- 1136 Rockwell Dr
- 702 Buckskin Trail