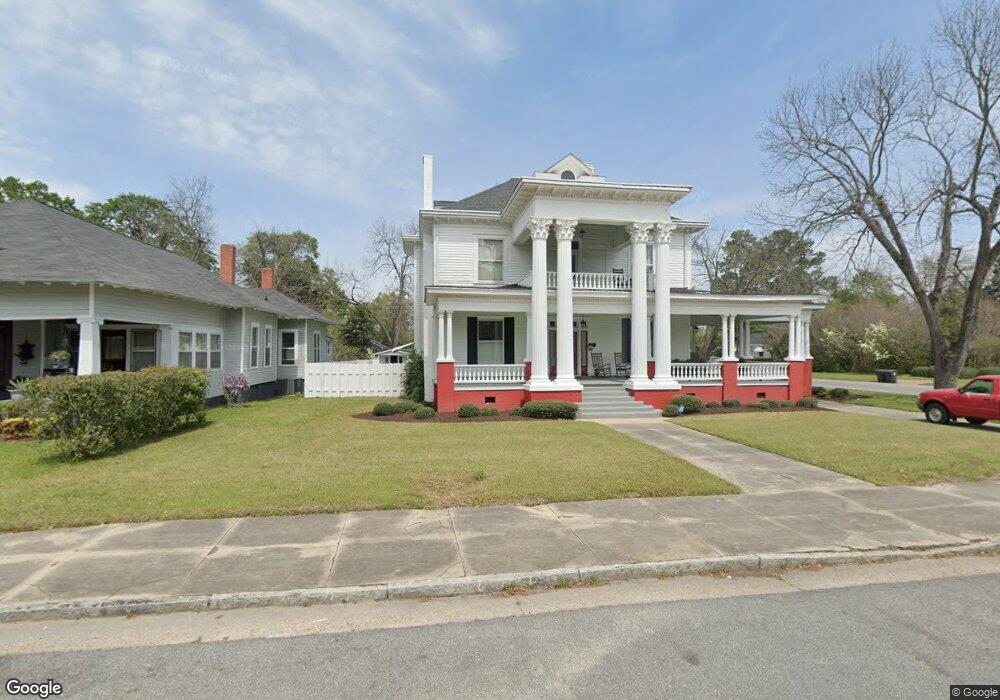
619 E 13th Ave Cordele, GA 31015
Estimated Value: $167,000 - $240,566
3
Beds
5
Baths
4,409
Sq Ft
$48/Sq Ft
Est. Value
About This Home
This home is located at 619 E 13th Ave, Cordele, GA 31015 and is currently estimated at $209,892, approximately $47 per square foot. 619 E 13th Ave is a home located in Crisp County with nearby schools including Crisp County Elementary School, Crisp County Primary School, and Crisp County Middle School.
Ownership History
Date
Name
Owned For
Owner Type
Purchase Details
Closed on
Jan 2, 2020
Sold by
Ross Carol N
Bought by
Ross Danny L
Current Estimated Value
Purchase Details
Closed on
Dec 15, 2003
Sold by
Bank One Fka First National Ba
Bought by
Ross Danny L and Ross Carol N
Purchase Details
Closed on
Nov 5, 2002
Sold by
Webb Mercedes
Bought by
Bank One Fka First National Bank Chicago
Purchase Details
Closed on
Jul 2, 1997
Sold by
Durham John and Durham Carla
Bought by
Webb Mercedes
Purchase Details
Closed on
Mar 8, 1988
Sold by
Hall Margaret
Bought by
Durham John and Durham Carla
Purchase Details
Closed on
Jan 20, 1987
Bought by
Hall Margaret
Create a Home Valuation Report for This Property
The Home Valuation Report is an in-depth analysis detailing your home's value as well as a comparison with similar homes in the area
Purchase History
| Date | Buyer | Sale Price | Title Company |
|---|---|---|---|
| Ross Danny L | -- | -- | |
| Ross Danny L | $65,000 | -- | |
| Bank One Fka First National Bank Chicago | $78,400 | -- | |
| Webb Mercedes | $109,000 | -- | |
| Durham John | $85,000 | -- | |
| Hall Margaret | $65,000 | -- |
Source: Public Records
Tax History
| Year | Tax Paid | Tax Assessment Tax Assessment Total Assessment is a certain percentage of the fair market value that is determined by local assessors to be the total taxable value of land and additions on the property. | Land | Improvement |
|---|---|---|---|---|
| 2025 | -- | $103,550 | $3,072 | $100,478 |
| 2024 | -- | $93,453 | $3,072 | $90,381 |
| 2023 | $3,256 | $88,405 | $3,072 | $85,333 |
| 2022 | $3,256 | $83,357 | $3,072 | $80,285 |
| 2021 | $3,059 | $78,309 | $3,072 | $75,237 |
| 2020 | $3,180 | $78,309 | $3,072 | $75,237 |
| 2019 | $3,180 | $78,309 | $3,072 | $75,237 |
| 2018 | $2,081 | $51,248 | $3,072 | $48,176 |
| 2017 | $2,081 | $51,248 | $3,072 | $48,176 |
| 2016 | $1,456 | $51,248 | $3,072 | $48,176 |
| 2015 | -- | $51,248 | $3,072 | $48,176 |
| 2014 | -- | $51,248 | $3,072 | $48,176 |
| 2013 | -- | $51,248 | $3,072 | $48,176 |
Source: Public Records
Map
Nearby Homes
Your Personal Tour Guide
Ask me questions while you tour the home.