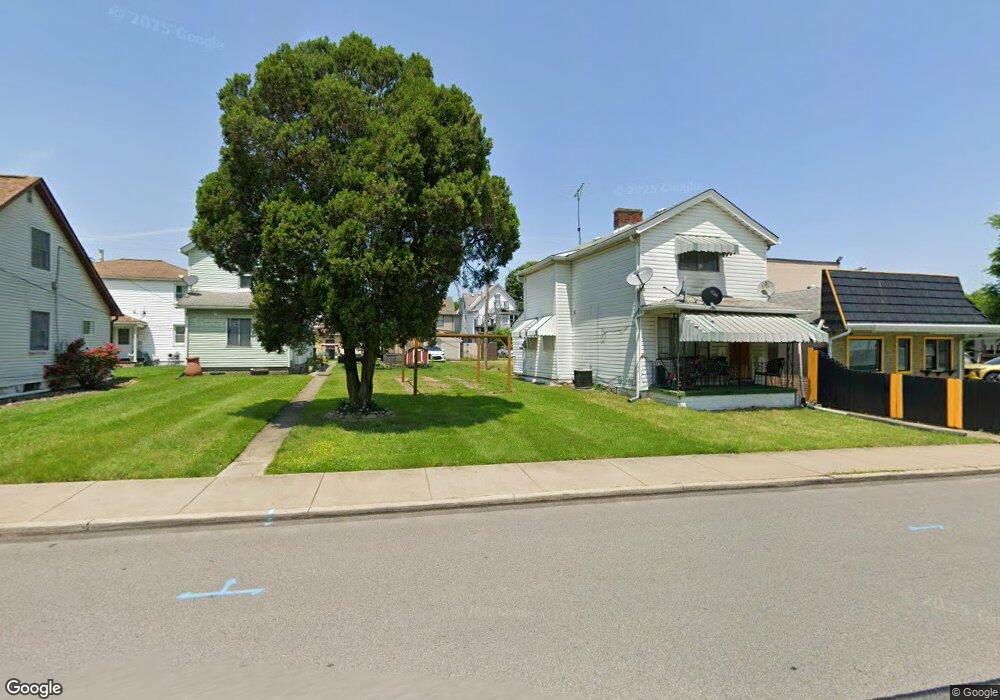
619 E 1st Ave Tarentum, PA 15084
Estimated Value: $60,861 - $73,000
2
Beds
2
Baths
1,042
Sq Ft
$65/Sq Ft
Est. Value
About This Home
This home is located at 619 E 1st Ave, Tarentum, PA 15084 and is currently estimated at $67,715, approximately $64 per square foot. 619 E 1st Ave is a home located in Allegheny County with nearby schools including Highlands Senior High School, Mary Queen of Apostles School, and St. Joseph High School.
Ownership History
Date
Name
Owned For
Owner Type
Purchase Details
Closed on
Oct 10, 2022
Sold by
Clark Robert R
Bought by
P G H Invest Homes L L C
Current Estimated Value
Purchase Details
Closed on
Aug 8, 2022
Sold by
Clark Robert R
Bought by
Pgh Investment Homes Llc
Purchase Details
Closed on
Feb 27, 2002
Sold by
Clark Joseph F and Clark Gerardine M
Bought by
Clark Robert R
Purchase Details
Closed on
Jul 1, 1993
Sold by
Clark Joseph F and Clark Lois M
Bought by
Clark Joseph F and Clark John C
Create a Home Valuation Report for This Property
The Home Valuation Report is an in-depth analysis detailing your home's value as well as a comparison with similar homes in the area
Home Values in the Area
Average Home Value in this Area
Purchase History
| Date | Buyer | Sale Price | Title Company |
|---|---|---|---|
| P G H Invest Homes L L C | $36,000 | -- | |
| Pgh Investment Homes Llc | $36,000 | -- | |
| Pgh Investment Homes Llc | $36,000 | -- | |
| Clark Robert R | $30,000 | -- | |
| Clark Joseph F | $30,000 | -- |
Source: Public Records
Tax History
| Year | Tax Paid | Tax Assessment Tax Assessment Total Assessment is a certain percentage of the fair market value that is determined by local assessors to be the total taxable value of land and additions on the property. | Land | Improvement |
|---|---|---|---|---|
| 2025 | $979 | $27,700 | $8,100 | $19,600 |
| 2024 | $979 | $27,700 | $8,100 | $19,600 |
| 2023 | $979 | $27,700 | $8,100 | $19,600 |
| 2022 | $972 | $27,700 | $8,100 | $19,600 |
| 2021 | $131 | $27,700 | $8,100 | $19,600 |
| 2020 | $972 | $27,700 | $8,100 | $19,600 |
| 2019 | $965 | $27,700 | $8,100 | $19,600 |
| 2018 | $131 | $27,700 | $8,100 | $19,600 |
| 2017 | $942 | $27,700 | $8,100 | $19,600 |
| 2016 | $131 | $27,700 | $8,100 | $19,600 |
| 2015 | $131 | $27,700 | $8,100 | $19,600 |
| 2014 | $942 | $27,700 | $8,100 | $19,600 |
Source: Public Records
Map
Nearby Homes
- 701 E 2nd Ave
- 623 E 3rd Ave
- 522 E 3rd Ave
- 511 E 2nd Ave
- 500 E 2nd Ave
- 426 E 2nd Ave
- 726 7th Ave
- 802 Horner St
- 515 E 8th Ave
- 920 Brackenridge Ave
- 524 Roup St
- 1010 Brackenridge Ave
- 313 E 9th Ave
- 721 Morgan St
- 211 E 7th Ave
- 103 E 1st Ave
- 343 E 11th Ave
- 1054-1056 Cleveland Ave
- 270 Kentucky Dr
- 1113-1115 Stieren Ave
Your Personal Tour Guide
Ask me questions while you tour the home.