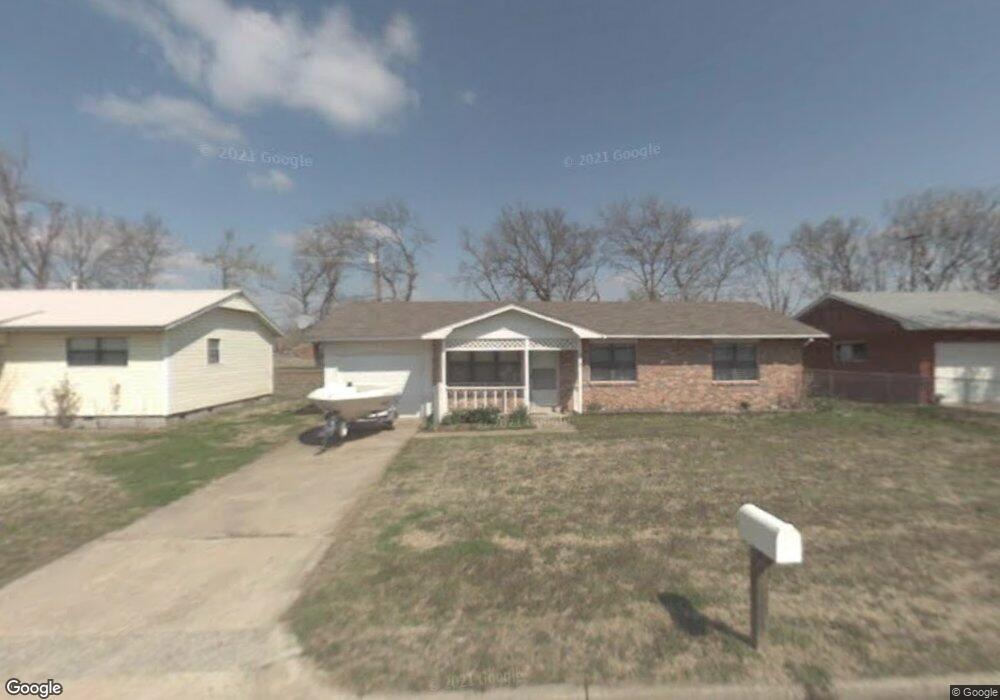
619 E Ross Locust Grove, OK 74352
Estimated Value: $108,000 - $147,000
2
Beds
1
Bath
960
Sq Ft
$135/Sq Ft
Est. Value
About This Home
This home is located at 619 E Ross, Locust Grove, OK 74352 and is currently estimated at $129,345, approximately $134 per square foot. 619 E Ross is a home located in Mayes County with nearby schools including Locust Grove Early Lrning Center, Locust Grove Upper Elementary School, and Locust Grove Middle School.
Ownership History
Date
Name
Owned For
Owner Type
Purchase Details
Closed on
Aug 21, 2020
Sold by
Mayes County
Bought by
James Ralph D
Current Estimated Value
Purchase Details
Closed on
Sep 1, 2005
Sold by
Anderson Jim C and Anderson Glynda A
Bought by
James Ii Ralph D
Home Financials for this Owner
Home Financials are based on the most recent Mortgage that was taken out on this home.
Original Mortgage
$32,000
Interest Rate
5.81%
Mortgage Type
Purchase Money Mortgage
Purchase Details
Closed on
Jan 22, 2002
Sold by
Johnson Claude Etal
Bought by
Anderson Jim and Anderson Glynda A
Purchase Details
Closed on
Jan 10, 2000
Sold by
Andrews D Kathleen
Bought by
Johnson, Claude Trust
Purchase Details
Closed on
Oct 2, 1995
Sold by
Cowan Cowan G and Cowan Dale
Bought by
Andrews Andrews D and Andrews Kathleen
Purchase Details
Closed on
Jun 15, 1995
Sold by
Parkhill Inc
Bought by
Cowan Cowan G and Cowan Dale
Create a Home Valuation Report for This Property
The Home Valuation Report is an in-depth analysis detailing your home's value as well as a comparison with similar homes in the area
Home Values in the Area
Average Home Value in this Area
Purchase History
| Date | Buyer | Sale Price | Title Company |
|---|---|---|---|
| James Ralph D | $36,000 | None Available | |
| James Ii Ralph D | $47,500 | None Available | |
| Anderson Jim | $47,500 | -- | |
| Johnson, Claude Trust | $38,000 | -- | |
| Andrews Andrews D | $32,500 | -- | |
| Cowan Cowan G | $17,500 | -- |
Source: Public Records
Mortgage History
| Date | Status | Borrower | Loan Amount |
|---|---|---|---|
| Previous Owner | James Ii Ralph D | $32,000 |
Source: Public Records
Tax History Compared to Growth
Tax History
| Year | Tax Paid | Tax Assessment Tax Assessment Total Assessment is a certain percentage of the fair market value that is determined by local assessors to be the total taxable value of land and additions on the property. | Land | Improvement |
|---|---|---|---|---|
| 2025 | $575 | $6,493 | $1,498 | $4,995 |
| 2023 | $575 | $5,890 | $1,415 | $4,475 |
| 2022 | $506 | $5,609 | $1,296 | $4,313 |
| 2021 | $516 | $5,597 | $1,296 | $4,301 |
| 2020 | $600 | $6,416 | $1,296 | $5,120 |
| 2019 | $548 | $5,852 | $2,055 | $3,797 |
| 2018 | $559 | $5,852 | $2,055 | $3,797 |
| 2017 | $559 | $5,852 | $2,055 | $3,797 |
| 2016 | $546 | $5,852 | $2,055 | $3,797 |
| 2015 | $564 | $5,852 | $2,055 | $3,797 |
| 2014 | $564 | $5,852 | $2,055 | $3,797 |
Source: Public Records
Map
Nearby Homes
- 57 Joe Koelsch Dr
- 8604 S County Road 4468
- 301 S Water St
- 212 N Mayes St
- 415 N Broadway
- 00 Hill St
- 815 S Cherokee St
- 715 S Cherokee St
- 608 S Cherokee St
- 1 W Ross St
- 310 W Harrison
- 000 Earl Smith Rd
- 0 Peach St
- 10171 U S Highway 412
- 0 Orange St
- 207 Orange St
- 6959 E 561 Rd
- 6164 E 578
- 149 SE 4404 Loop
- 173 Dove Rd