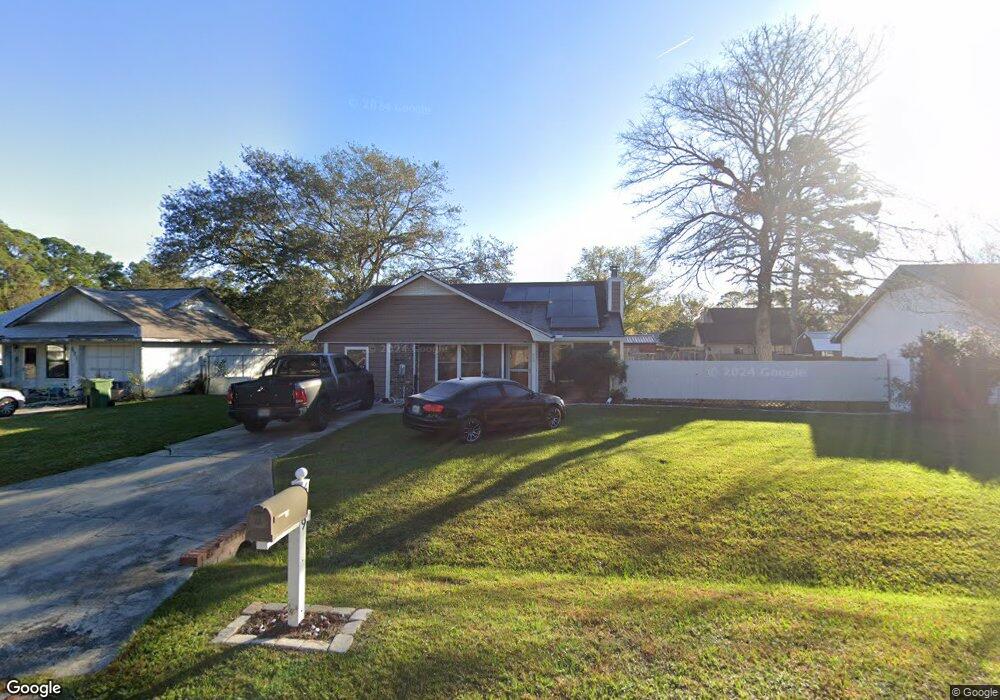
619 Hampton St Hinesville, GA 31313
Estimated Value: $173,000 - $212,000
3
Beds
1
Bath
1,365
Sq Ft
$147/Sq Ft
Est. Value
About This Home
This home is located at 619 Hampton St, Hinesville, GA 31313 and is currently estimated at $200,054, approximately $146 per square foot. 619 Hampton St is a home located in Liberty County with nearby schools including Button Gwinnett Elementary School, Snelson-Golden Middle School, and Bradwell Institute.
Ownership History
Date
Name
Owned For
Owner Type
Purchase Details
Closed on
Jul 18, 2008
Sold by
Waters Charles P
Bought by
Drayton James L
Current Estimated Value
Home Financials for this Owner
Home Financials are based on the most recent Mortgage that was taken out on this home.
Original Mortgage
$85,000
Outstanding Balance
$55,664
Interest Rate
6.37%
Mortgage Type
New Conventional
Estimated Equity
$144,390
Purchase Details
Closed on
Dec 18, 1989
Bought by
Waters Charles
Create a Home Valuation Report for This Property
The Home Valuation Report is an in-depth analysis detailing your home's value as well as a comparison with similar homes in the area
Home Values in the Area
Average Home Value in this Area
Purchase History
| Date | Buyer | Sale Price | Title Company |
|---|---|---|---|
| Drayton James L | $85,000 | -- | |
| Waters Charles | $54,400 | -- |
Source: Public Records
Mortgage History
| Date | Status | Borrower | Loan Amount |
|---|---|---|---|
| Open | Drayton James L | $85,000 |
Source: Public Records
Tax History Compared to Growth
Tax History
| Year | Tax Paid | Tax Assessment Tax Assessment Total Assessment is a certain percentage of the fair market value that is determined by local assessors to be the total taxable value of land and additions on the property. | Land | Improvement |
|---|---|---|---|---|
| 2024 | $23 | $73,243 | $14,000 | $59,243 |
| 2023 | $23 | $64,800 | $12,000 | $52,800 |
| 2022 | $22 | $51,254 | $9,200 | $42,054 |
| 2021 | $22 | $46,550 | $9,200 | $37,350 |
| 2020 | $21 | $45,394 | $9,200 | $36,194 |
| 2019 | $21 | $45,792 | $9,200 | $36,592 |
| 2018 | $21 | $39,492 | $9,200 | $30,292 |
| 2017 | $1,314 | $39,891 | $9,200 | $30,691 |
| 2016 | $1,489 | $39,891 | $9,200 | $30,691 |
| 2015 | $1,457 | $34,701 | $6,800 | $27,901 |
| 2014 | $1,457 | $36,867 | $8,800 | $28,067 |
| 2013 | -- | $33,609 | $8,800 | $24,809 |
Source: Public Records
Map
Nearby Homes