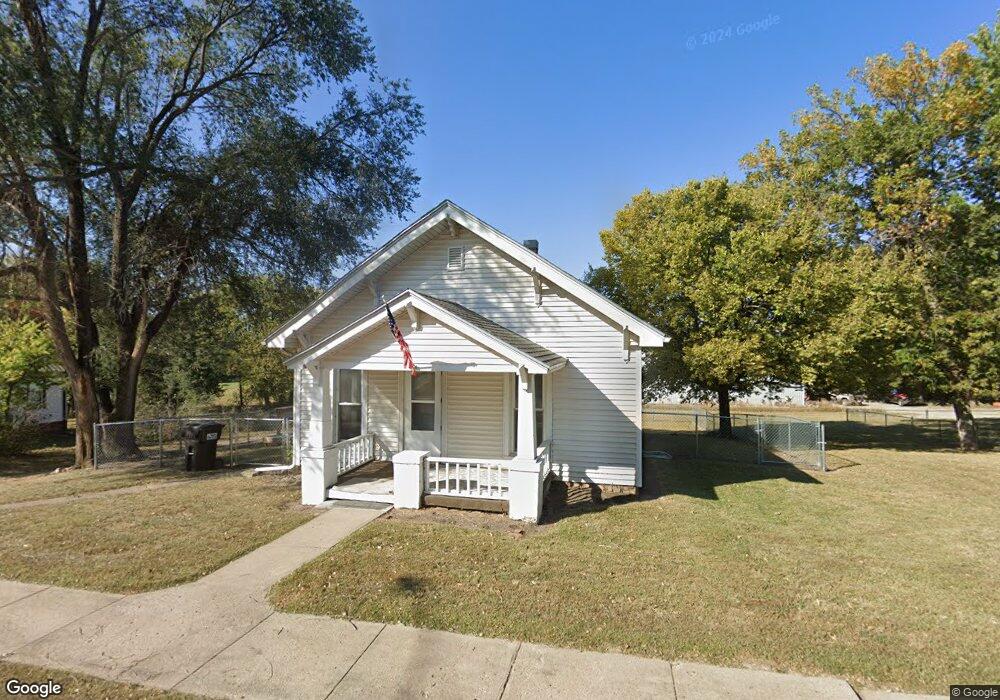
619 Long Branch St Humboldt, NE 68376
Estimated Value: $60,866 - $108,000
2
Beds
1
Bath
788
Sq Ft
$116/Sq Ft
Est. Value
About This Home
This home is located at 619 Long Branch St, Humboldt, NE 68376 and is currently estimated at $91,717, approximately $116 per square foot. 619 Long Branch St is a home located in Richardson County with nearby schools including HTRS Elementary School, HTRS Middle School, and HTRS High School.
Ownership History
Date
Name
Owned For
Owner Type
Purchase Details
Closed on
Oct 19, 2022
Sold by
Schneider Richard
Bought by
Sailors Roxanne R
Current Estimated Value
Purchase Details
Closed on
Dec 6, 2016
Sold by
May Vernon E and May Annie L
Bought by
Schneider Richard and Schneider Tevia
Purchase Details
Closed on
Jan 28, 2010
Sold by
Nanninga Construction Inc
Bought by
May Vernon E and May Annie L
Purchase Details
Closed on
Oct 19, 2007
Sold by
Arington Gary K and Arington Carol M
Bought by
Nanninga Construction Inc
Purchase Details
Closed on
Aug 22, 2007
Sold by
Mendenhall Robert R and Mendenhall Pamela A
Bought by
Arington Gary K and Arington Carol M
Purchase Details
Closed on
Dec 22, 2005
Sold by
Snethen Roxanne M Barnes
Bought by
Mendenhall Robert R and Mendenhall Pamela A
Purchase Details
Closed on
May 11, 2004
Sold by
Barnes Leroy D and Barnes Roxanne
Bought by
Snethen Roxanne M Barnes
Create a Home Valuation Report for This Property
The Home Valuation Report is an in-depth analysis detailing your home's value as well as a comparison with similar homes in the area
Home Values in the Area
Average Home Value in this Area
Purchase History
| Date | Buyer | Sale Price | Title Company |
|---|---|---|---|
| Sailors Roxanne R | $27,000 | -- | |
| Schneider Richard | $24,000 | -- | |
| May Vernon E | $24,000 | -- | |
| Nanninga Construction Inc | $22,000 | -- | |
| Arington Gary K | $15,000 | -- | |
| Mendenhall Robert R | $17,000 | -- | |
| Snethen Roxanne M Barnes | -- | -- |
Source: Public Records
Tax History Compared to Growth
Tax History
| Year | Tax Paid | Tax Assessment Tax Assessment Total Assessment is a certain percentage of the fair market value that is determined by local assessors to be the total taxable value of land and additions on the property. | Land | Improvement |
|---|---|---|---|---|
| 2025 | -- | $29,010 | $4,739 | $24,271 |
| 2024 | -- | $28,324 | $4,739 | $23,585 |
| 2023 | $0 | $34,768 | $4,739 | $30,029 |
| 2022 | $435 | $23,098 | $2,078 | $21,020 |
| 2021 | $461 | $25,469 | $2,078 | $23,391 |
| 2020 | $455 | $24,355 | $2,078 | $22,277 |
| 2019 | $430 | $23,706 | $2,078 | $21,628 |
| 2018 | $426 | $22,104 | $2,078 | $20,026 |
| 2017 | $428 | $22,104 | $2,078 | $20,026 |
| 2016 | $456 | $22,104 | $2,078 | $20,026 |
| 2015 | $468 | $22,104 | $2,078 | $20,026 |
| 2014 | $494 | $22,859 | $2,078 | $20,781 |
Source: Public Records
Map
Nearby Homes