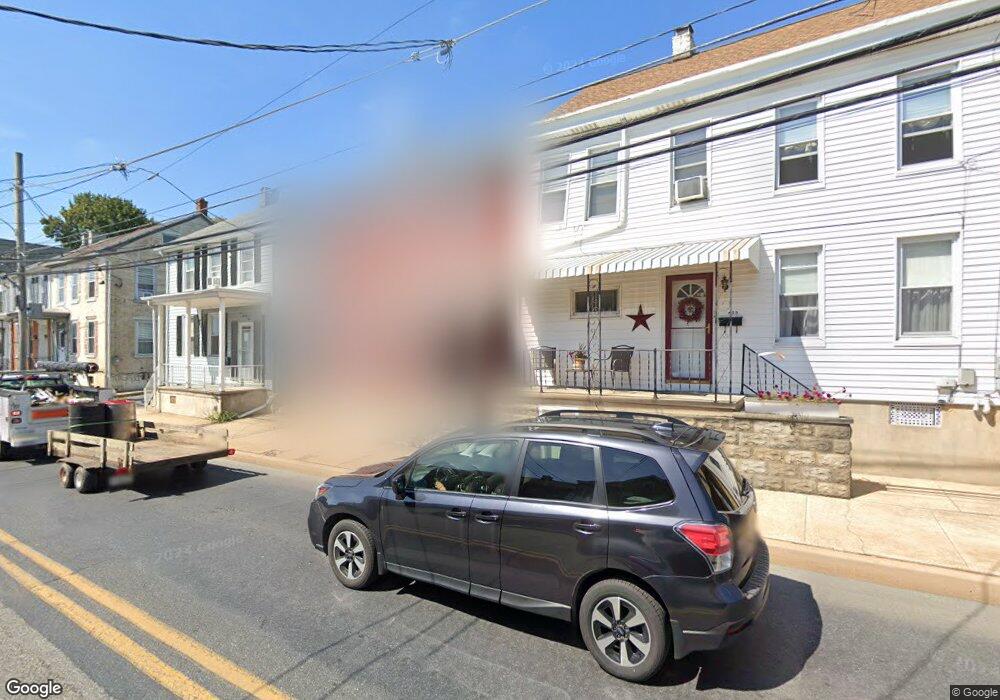
619 Maple St Lebanon, PA 17046
Estimated Value: $155,739 - $177,000
3
Beds
1
Bath
1,240
Sq Ft
$134/Sq Ft
Est. Value
About This Home
This home is located at 619 Maple St, Lebanon, PA 17046 and is currently estimated at $166,435, approximately $134 per square foot. 619 Maple St is a home located in Lebanon County with nearby schools including Northwest Elementary School, Lebanon Intermediate School, and Lebanon Senior High School.
Ownership History
Date
Name
Owned For
Owner Type
Purchase Details
Closed on
Sep 28, 2007
Sold by
Roth Maryann
Bought by
Ramsey Matthew S and Ramsey Tina
Current Estimated Value
Home Financials for this Owner
Home Financials are based on the most recent Mortgage that was taken out on this home.
Original Mortgage
$65,000
Outstanding Balance
$41,509
Interest Rate
6.65%
Mortgage Type
New Conventional
Estimated Equity
$124,926
Create a Home Valuation Report for This Property
The Home Valuation Report is an in-depth analysis detailing your home's value as well as a comparison with similar homes in the area
Home Values in the Area
Average Home Value in this Area
Purchase History
| Date | Buyer | Sale Price | Title Company |
|---|---|---|---|
| Ramsey Matthew S | $65,000 | None Available |
Source: Public Records
Mortgage History
| Date | Status | Borrower | Loan Amount |
|---|---|---|---|
| Open | Ramsey Matthew S | $65,000 |
Source: Public Records
Tax History Compared to Growth
Tax History
| Year | Tax Paid | Tax Assessment Tax Assessment Total Assessment is a certain percentage of the fair market value that is determined by local assessors to be the total taxable value of land and additions on the property. | Land | Improvement |
|---|---|---|---|---|
| 2025 | $2,184 | $67,800 | $9,900 | $57,900 |
| 2024 | $2,081 | $67,800 | $9,900 | $57,900 |
| 2023 | $2,081 | $67,800 | $9,900 | $57,900 |
| 2022 | $2,047 | $67,800 | $9,900 | $57,900 |
| 2021 | $1,977 | $67,800 | $9,900 | $57,900 |
| 2020 | $1,977 | $67,800 | $9,900 | $57,900 |
| 2019 | $1,949 | $67,800 | $9,900 | $57,900 |
| 2018 | $1,893 | $67,800 | $9,900 | $57,900 |
| 2017 | $534 | $67,800 | $9,900 | $57,900 |
| 2016 | $1,842 | $67,800 | $9,900 | $57,900 |
| 2015 | $854 | $67,800 | $9,900 | $57,900 |
| 2014 | $854 | $67,800 | $9,900 | $57,900 |
Source: Public Records
Map
Nearby Homes