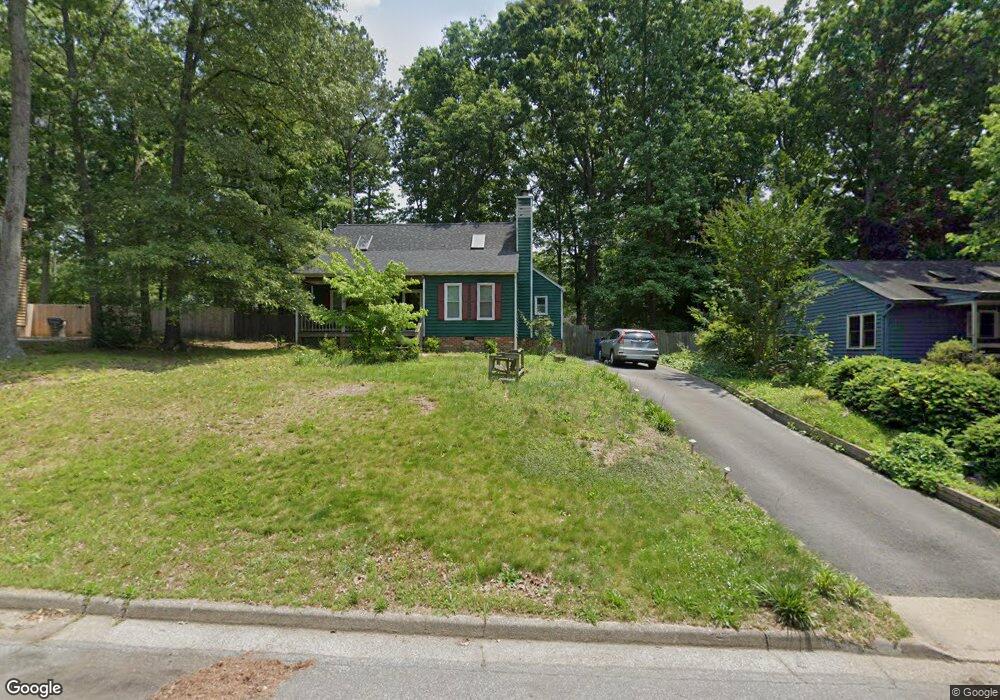
619 Marbleridge Rd North Chesterfield, VA 23236
Estimated Value: $316,000 - $369,000
3
Beds
3
Baths
1,592
Sq Ft
$217/Sq Ft
Est. Value
About This Home
This home is located at 619 Marbleridge Rd, North Chesterfield, VA 23236 and is currently estimated at $346,254, approximately $217 per square foot. 619 Marbleridge Rd is a home located in Chesterfield County with nearby schools including Reams Road Elementary School, Providence Middle School, and Monacan High School.
Ownership History
Date
Name
Owned For
Owner Type
Purchase Details
Closed on
Mar 24, 2018
Sold by
Harrell Joanne
Bought by
Harrell Joanne
Current Estimated Value
Purchase Details
Closed on
Feb 24, 2005
Sold by
Bilby Mark
Bought by
Richmond Joanne
Home Financials for this Owner
Home Financials are based on the most recent Mortgage that was taken out on this home.
Original Mortgage
$155,000
Outstanding Balance
$79,205
Interest Rate
5.73%
Mortgage Type
New Conventional
Estimated Equity
$267,049
Purchase Details
Closed on
Sep 25, 2002
Sold by
Haney Lisa C
Bought by
Bilby Mark G and Bilby Tamara D
Home Financials for this Owner
Home Financials are based on the most recent Mortgage that was taken out on this home.
Original Mortgage
$115,900
Interest Rate
6.25%
Mortgage Type
New Conventional
Purchase Details
Closed on
Mar 23, 1999
Sold by
Haney Lisa C
Bought by
Haney Lisa C
Create a Home Valuation Report for This Property
The Home Valuation Report is an in-depth analysis detailing your home's value as well as a comparison with similar homes in the area
Home Values in the Area
Average Home Value in this Area
Purchase History
| Date | Buyer | Sale Price | Title Company |
|---|---|---|---|
| Harrell Joanne | -- | None Available | |
| Richmond Joanne | $155,000 | -- | |
| Bilby Mark G | $122,000 | -- | |
| Haney Lisa C | -- | -- |
Source: Public Records
Mortgage History
| Date | Status | Borrower | Loan Amount |
|---|---|---|---|
| Open | Richmond Joanne | $155,000 | |
| Previous Owner | Haney Lisa C | $115,900 |
Source: Public Records
Tax History Compared to Growth
Tax History
| Year | Tax Paid | Tax Assessment Tax Assessment Total Assessment is a certain percentage of the fair market value that is determined by local assessors to be the total taxable value of land and additions on the property. | Land | Improvement |
|---|---|---|---|---|
| 2025 | $3,056 | $340,600 | $63,000 | $277,600 |
| 2024 | $3,056 | $292,300 | $58,000 | $234,300 |
| 2023 | $2,433 | $267,400 | $54,000 | $213,400 |
| 2022 | $2,278 | $247,600 | $52,000 | $195,600 |
| 2021 | $2,186 | $223,200 | $50,000 | $173,200 |
| 2020 | $1,962 | $206,500 | $50,000 | $156,500 |
| 2019 | $1,796 | $189,100 | $45,000 | $144,100 |
| 2018 | $1,739 | $183,000 | $43,000 | $140,000 |
| 2017 | $1,624 | $169,200 | $42,000 | $127,200 |
| 2016 | $1,492 | $155,400 | $38,000 | $117,400 |
| 2015 | $1,498 | $153,400 | $38,000 | $115,400 |
| 2014 | $1,461 | $149,600 | $38,000 | $111,600 |
Source: Public Records
Map
Nearby Homes
- 10500 Royal Cresent Way
- 807 Sun Valley Way
- 10500 Cherylann Rd
- 210 Pumpkin Place
- 100 Moorwood Ridge Dr
- 61 Reykin Dr
- 1200 Hybla Rd
- 11214 Lantern Way
- 206 Twin Crest Dr
- 9611 Kennesaw Rd
- 10965 Keithwood Pkwy
- 142 Heppel Rd
- 149 N Courthouse Rd
- 11400 N Wedgemont Dr
- 1331 Burlington Rd
- 10313 Saint Joan Ave
- 1213 Wycliff Ct
- 1002 Wedgemont Place
- 1615 Winters Hill Cir
- 1700 Winters Hill Cir
- 613 Marbleridge Rd
- 625 Marbleridge Rd
- 10206 Battenburg Place
- 10208 Battenburg Place
- 10204 Battenburg Place
- 607 Marbleridge Rd
- 605 Clearlake Rd
- 618 Marbleridge Rd
- 624 Marbleridge Rd
- 612 Marbleridge Rd
- 630 Marbleridge Rd
- 701 Marbleridge Rd
- 10200 Battenburg Place
- 606 Marbleridge Rd
- 600 Queensway Rd
- 700 Marbleridge Rd
- 606 Queensway Rd
- 10507 Queensway Ct
- 707 Marbleridge Rd
- 10207 Battenburg Place