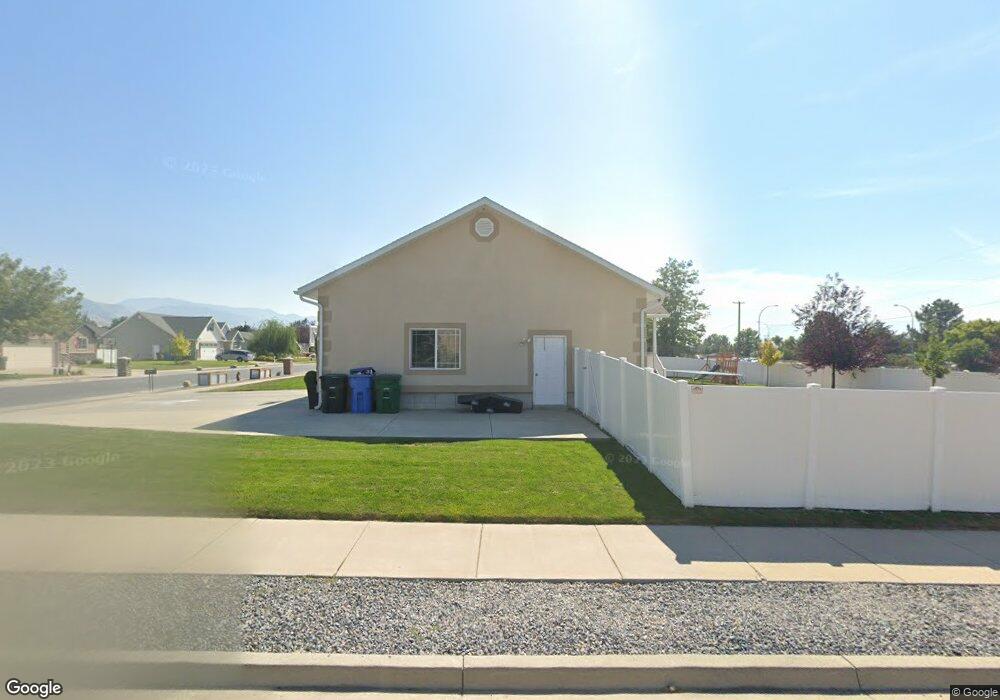
619 N 50 E Smithfield, UT 84335
Estimated Value: $475,493 - $539,000
4
Beds
2
Baths
2,608
Sq Ft
$192/Sq Ft
Est. Value
About This Home
This home is located at 619 N 50 E, Smithfield, UT 84335 and is currently estimated at $501,623, approximately $192 per square foot. 619 N 50 E is a home located in Cache County with nearby schools including Birch Creek School, North Cache Middle School, and White Pine Middle School.
Ownership History
Date
Name
Owned For
Owner Type
Purchase Details
Closed on
Sep 3, 2015
Sold by
Sunwest Trust Inc
Bought by
Webb David and Webb Alisha
Current Estimated Value
Home Financials for this Owner
Home Financials are based on the most recent Mortgage that was taken out on this home.
Original Mortgage
$223,469
Outstanding Balance
$174,915
Interest Rate
3.97%
Mortgage Type
New Conventional
Estimated Equity
$326,708
Purchase Details
Closed on
Sep 23, 2014
Sold by
Hoyt Clinton T and Hoyt Aimee
Bought by
Sunwest Trust Inc and Mathew L Donaldson Ira
Purchase Details
Closed on
May 31, 2005
Sold by
Hunter Meadows Development Company Inc
Bought by
Hoyt Clinton T and Hoyt Aimee
Home Financials for this Owner
Home Financials are based on the most recent Mortgage that was taken out on this home.
Original Mortgage
$165,750
Interest Rate
5.74%
Mortgage Type
Construction
Create a Home Valuation Report for This Property
The Home Valuation Report is an in-depth analysis detailing your home's value as well as a comparison with similar homes in the area
Home Values in the Area
Average Home Value in this Area
Purchase History
| Date | Buyer | Sale Price | Title Company |
|---|---|---|---|
| Webb David | -- | Advanced Title | |
| Sunwest Trust Inc | $160,368 | Etitle Insurance Agency | |
| Hoyt Clinton T | -- | Northern Title Company |
Source: Public Records
Mortgage History
| Date | Status | Borrower | Loan Amount |
|---|---|---|---|
| Open | Webb David | $223,469 | |
| Previous Owner | Hoyt Clinton T | $165,750 |
Source: Public Records
Tax History
| Year | Tax Paid | Tax Assessment Tax Assessment Total Assessment is a certain percentage of the fair market value that is determined by local assessors to be the total taxable value of land and additions on the property. | Land | Improvement |
|---|---|---|---|---|
| 2025 | $1,903 | $254,765 | $0 | $0 |
| 2024 | $2,201 | $276,350 | $0 | $0 |
| 2023 | $2,311 | $274,410 | $0 | $0 |
| 2022 | $2,348 | $274,405 | $0 | $0 |
| 2021 | $2,314 | $413,140 | $70,000 | $343,140 |
| 2020 | $1,704 | $283,785 | $70,000 | $213,785 |
| 2019 | $1,662 | $263,785 | $50,000 | $213,785 |
| 2018 | $1,536 | $235,900 | $50,000 | $185,900 |
| 2017 | $1,436 | $120,450 | $0 | $0 |
| 2016 | $1,461 | $120,450 | $0 | $0 |
| 2015 | $1,326 | $108,855 | $0 | $0 |
| 2014 | $1,297 | $108,580 | $0 | $0 |
| 2013 | -- | $108,580 | $0 | $0 |
Source: Public Records
Map
Nearby Homes
Your Personal Tour Guide
Ask me questions while you tour the home.