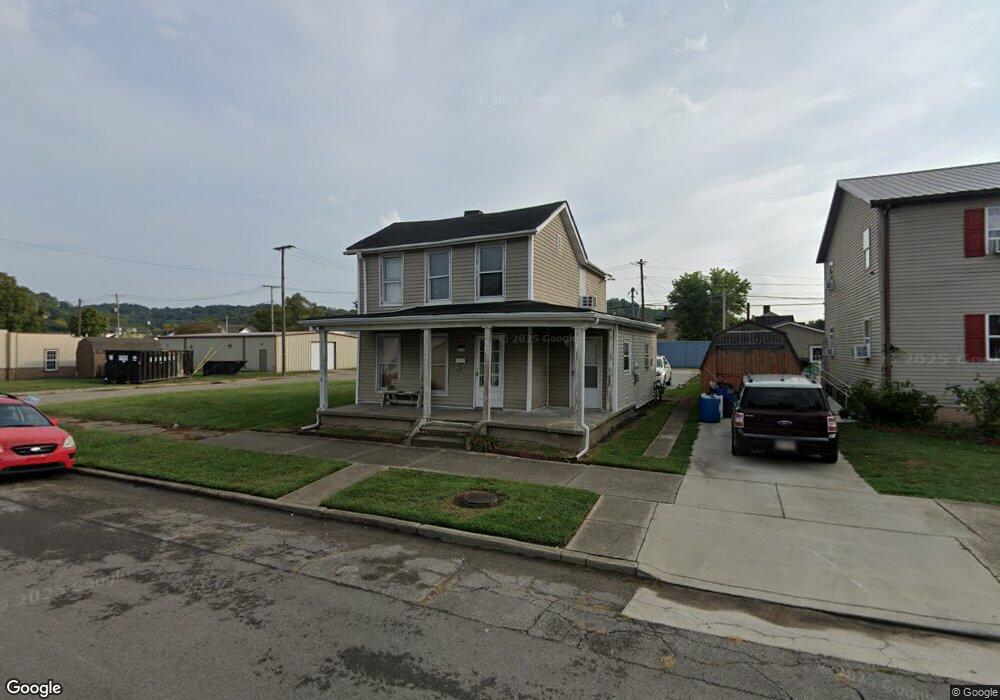
619 N 5th St Ironton, OH 45638
Estimated Value: $66,000 - $103,000
2
Beds
1
Bath
1,365
Sq Ft
$64/Sq Ft
Est. Value
About This Home
This home is located at 619 N 5th St, Ironton, OH 45638 and is currently estimated at $87,906, approximately $64 per square foot. 619 N 5th St is a home located in Lawrence County with nearby schools including Ironton Elementary School, Ironton Middle School, and Ironton High School.
Ownership History
Date
Name
Owned For
Owner Type
Purchase Details
Closed on
Jan 4, 2018
Sold by
Springboard Housing Lvai Llc
Bought by
Bond Larry B
Current Estimated Value
Purchase Details
Closed on
Oct 30, 2014
Sold by
Hogar Community Reinvestment Llc
Bought by
Springboard Housing Lvai Llc
Purchase Details
Closed on
Mar 20, 2013
Sold by
Wells Fargo Bank
Bought by
Hogar Community Reinvestments Llc
Purchase Details
Closed on
Feb 25, 2013
Sold by
Wilds Timothy
Bought by
Hsbc Bank Usa Na and Citigroup Mortgage Loan Trust Inc
Purchase Details
Closed on
Jan 2, 1997
Sold by
Howell Dale F
Bought by
Wilds Timothy and Wilds Sherry
Purchase Details
Closed on
Aug 19, 1996
Bought by
Howell Dale F
Purchase Details
Closed on
Apr 21, 1993
Sold by
Howell Mildred
Bought by
Howell, Mildred Life Esta
Create a Home Valuation Report for This Property
The Home Valuation Report is an in-depth analysis detailing your home's value as well as a comparison with similar homes in the area
Home Values in the Area
Average Home Value in this Area
Purchase History
| Date | Buyer | Sale Price | Title Company |
|---|---|---|---|
| Bond Larry B | $10,000 | None Available | |
| Springboard Housing Lvai Llc | $1,000 | None Available | |
| Hogar Community Reinvestments Llc | -- | None Available | |
| Hsbc Bank Usa Na | $32,667 | None Available | |
| Wilds Timothy | $25,500 | -- | |
| Howell Dale F | -- | -- | |
| Howell, Mildred Life Esta | -- | -- |
Source: Public Records
Tax History Compared to Growth
Tax History
| Year | Tax Paid | Tax Assessment Tax Assessment Total Assessment is a certain percentage of the fair market value that is determined by local assessors to be the total taxable value of land and additions on the property. | Land | Improvement |
|---|---|---|---|---|
| 2024 | -- | $24,850 | $5,760 | $19,090 |
| 2023 | $924 | $24,850 | $5,760 | $19,090 |
| 2022 | $922 | $24,850 | $5,760 | $19,090 |
| 2021 | $793 | $20,590 | $5,200 | $15,390 |
| 2020 | $809 | $20,590 | $5,200 | $15,390 |
| 2019 | $511 | $12,900 | $5,200 | $7,700 |
| 2018 | $815 | $20,590 | $5,200 | $15,390 |
| 2017 | $1,508 | $20,590 | $5,200 | $15,390 |
| 2016 | $2,708 | $20,590 | $5,200 | $15,390 |
| 2015 | $1,366 | $17,300 | $5,200 | $12,100 |
| 2014 | $1,269 | $17,300 | $5,200 | $12,100 |
| 2013 | $675 | $17,300 | $5,200 | $12,100 |
Source: Public Records
Map
Nearby Homes
- 619 Mill St
- 415 N 7th St
- 717 Buckhorn St
- 922 N 5th St Unit JO10
- 922 N 5th St
- 2213 N 6th St
- 101 S 8th St
- 1310 N 3rd St
- 520 S 10th St
- 605 S 10th St
- 448 Boyd St
- 325 Etna St
- 0 Ora Richey Rd
- 1513 Karin St
- 817 S 4th St
- 217 Amanda St
- 228 Etna St
- 230 Rock Ave
- 914 S 8th St Unit IO-2
- 717 Chestnut St Unit IO-1
- 613 N 5th St
- 611 N 5th St
- 618 N 6th St Unit 620
- 618 N 5th St
- 601 N 5th St
- 513 Mill St
- 622 N 5th St
- 616 N 6th St
- 612 N 6th St
- 608 N 6th St
- 509 Hecla St
- 622 N 6th St
- 614 N 5th St
- 612 N 5th St
- 612 N 5th St Unit GO-2
- 612 N 5th St Unit IO-2
- 612 N 5th St Unit GO-1
- 608 N 5th St
- 419 Mill St Unit 421
- 523 Hecla St