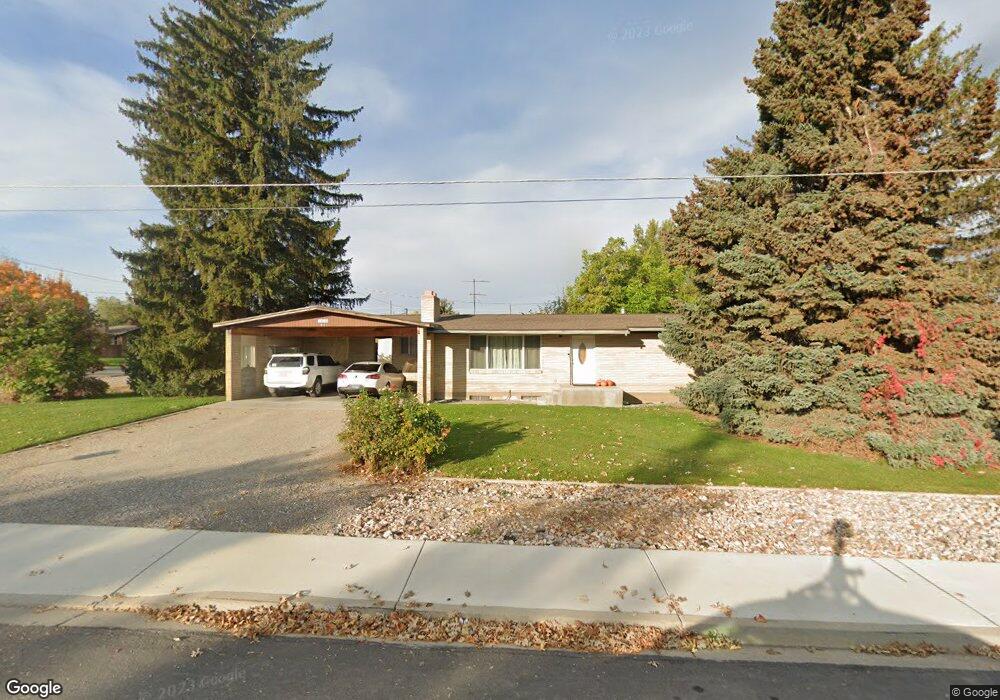
619 N 600 E Payson, UT 84651
Estimated Value: $459,000 - $503,853
3
Beds
2
Baths
2,444
Sq Ft
$197/Sq Ft
Est. Value
About This Home
This home is located at 619 N 600 E, Payson, UT 84651 and is currently estimated at $480,284, approximately $196 per square foot. 619 N 600 E is a home located in Utah County with nearby schools including Barnett Elementary School, Salem Junior High School, and Valley View Middle School.
Ownership History
Date
Name
Owned For
Owner Type
Purchase Details
Closed on
Nov 10, 2021
Sold by
Roman Draney
Bought by
Draney Roman and Draney Anna
Current Estimated Value
Home Financials for this Owner
Home Financials are based on the most recent Mortgage that was taken out on this home.
Original Mortgage
$396,004
Outstanding Balance
$360,131
Interest Rate
3.05%
Mortgage Type
New Conventional
Estimated Equity
$120,154
Purchase Details
Closed on
Apr 15, 2016
Sold by
Oberg Betty Jean and Oberg Betty Jean Mccoy
Bought by
The Bernard A Oberg And Betty Jean Oberg and Pulver Carol Jean
Create a Home Valuation Report for This Property
The Home Valuation Report is an in-depth analysis detailing your home's value as well as a comparison with similar homes in the area
Home Values in the Area
Average Home Value in this Area
Purchase History
| Date | Buyer | Sale Price | Title Company |
|---|---|---|---|
| Draney Roman | -- | Accommodation/Courtesy Recordi | |
| Draney Roman | -- | Wasatch Land & Title | |
| The Bernard A Oberg And Betty Jean Oberg | -- | None Available |
Source: Public Records
Mortgage History
| Date | Status | Borrower | Loan Amount |
|---|---|---|---|
| Open | Draney Roman | $396,004 |
Source: Public Records
Tax History
| Year | Tax Paid | Tax Assessment Tax Assessment Total Assessment is a certain percentage of the fair market value that is determined by local assessors to be the total taxable value of land and additions on the property. | Land | Improvement |
|---|---|---|---|---|
| 2025 | $2,067 | $251,790 | -- | -- |
| 2024 | $2,067 | $210,320 | $0 | $0 |
| 2023 | $1,976 | $201,630 | $0 | $0 |
| 2022 | $2,018 | $202,510 | $0 | $0 |
| 2021 | $1,723 | $277,400 | $98,500 | $178,900 |
| 2020 | $1,632 | $257,000 | $89,500 | $167,500 |
| 2019 | $1,456 | $235,100 | $80,200 | $154,900 |
| 2018 | $667 | $225,800 | $71,600 | $154,200 |
| 2017 | $443 | $112,915 | $0 | $0 |
| 2016 | $417 | $108,185 | $0 | $0 |
| 2015 | $328 | $95,700 | $0 | $0 |
| 2014 | $138 | $85,800 | $0 | $0 |
Source: Public Records
Map
Nearby Homes
Your Personal Tour Guide
Ask me questions while you tour the home.