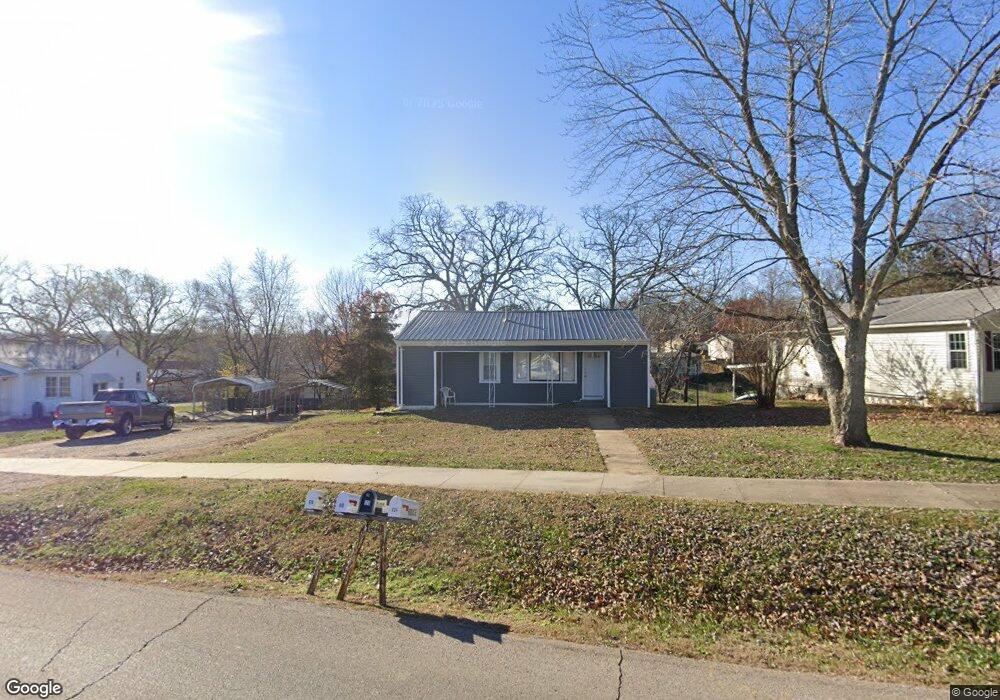
619 N Division St Bonne Terre, MO 63628
Estimated Value: $116,000 - $147,000
2
Beds
1
Bath
856
Sq Ft
$145/Sq Ft
Est. Value
About This Home
This home is located at 619 N Division St, Bonne Terre, MO 63628 and is currently estimated at $124,279, approximately $145 per square foot. 619 N Division St is a home located in St. Francois County with nearby schools including North County Primary School, North County Parkside Elementary School, and North County Senior High School.
Ownership History
Date
Name
Owned For
Owner Type
Purchase Details
Closed on
Sep 9, 2022
Sold by
Marler Brandon K and Marler Amanda
Bought by
Bess Properties Llc
Current Estimated Value
Home Financials for this Owner
Home Financials are based on the most recent Mortgage that was taken out on this home.
Original Mortgage
$88,000
Outstanding Balance
$66,334
Interest Rate
5.35%
Mortgage Type
Construction
Estimated Equity
$57,945
Purchase Details
Closed on
Dec 27, 2005
Sold by
Reda William L and Reda Donna A
Bought by
Marler Brandon K
Create a Home Valuation Report for This Property
The Home Valuation Report is an in-depth analysis detailing your home's value as well as a comparison with similar homes in the area
Home Values in the Area
Average Home Value in this Area
Purchase History
| Date | Buyer | Sale Price | Title Company |
|---|---|---|---|
| Bess Properties Llc | $110,000 | American Heritage Abs Co | |
| Marler Brandon K | -- | -- |
Source: Public Records
Mortgage History
| Date | Status | Borrower | Loan Amount |
|---|---|---|---|
| Open | Bess Properties Llc | $88,000 |
Source: Public Records
Tax History Compared to Growth
Tax History
| Year | Tax Paid | Tax Assessment Tax Assessment Total Assessment is a certain percentage of the fair market value that is determined by local assessors to be the total taxable value of land and additions on the property. | Land | Improvement |
|---|---|---|---|---|
| 2024 | $476 | $8,040 | $2,080 | $5,960 |
| 2023 | $476 | $8,040 | $2,080 | $5,960 |
| 2022 | $480 | $8,040 | $2,080 | $5,960 |
| 2021 | $479 | $8,040 | $2,080 | $5,960 |
| 2020 | $472 | $7,860 | $1,900 | $5,960 |
| 2019 | $473 | $7,860 | $1,900 | $5,960 |
| 2018 | -- | $7,860 | $1,900 | $5,960 |
| 2017 | -- | $7,860 | $1,900 | $5,960 |
| 2016 | $429 | $7,860 | $0 | $0 |
| 2015 | -- | $7,540 | $0 | $0 |
| 2014 | -- | $7,540 | $0 | $0 |
| 2013 | -- | $7,540 | $0 | $0 |
Source: Public Records
Map
Nearby Homes