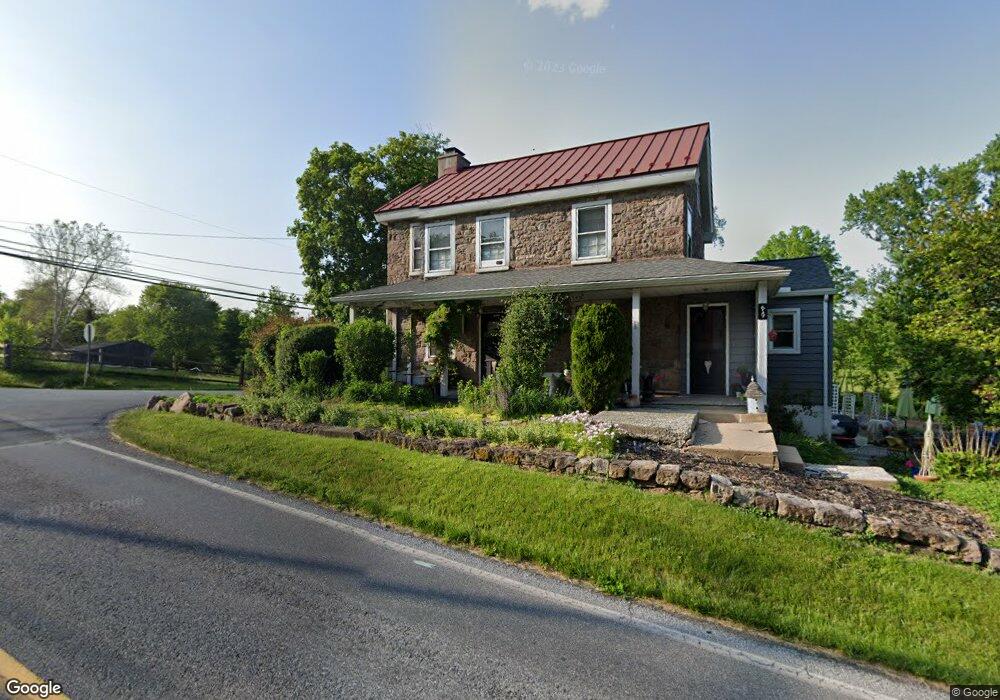
619 Pughtown Rd Spring City, PA 19475
Estimated Value: $508,265 - $696,000
3
Beds
1
Bath
1,542
Sq Ft
$386/Sq Ft
Est. Value
About This Home
This home is located at 619 Pughtown Rd, Spring City, PA 19475 and is currently estimated at $594,816, approximately $385 per square foot. 619 Pughtown Rd is a home located in Chester County with nearby schools including French Creek Elementary School, Owen J Roberts Middle School, and Owen J Roberts High School.
Ownership History
Date
Name
Owned For
Owner Type
Purchase Details
Closed on
Dec 30, 1999
Sold by
Morgan Michael P and Morgan Debra
Bought by
Hayes Jane T
Current Estimated Value
Home Financials for this Owner
Home Financials are based on the most recent Mortgage that was taken out on this home.
Original Mortgage
$139,500
Interest Rate
7.71%
Purchase Details
Closed on
Sep 29, 1998
Sold by
Lahr Janet L
Bought by
Morgan Michael P and Morgan Debra A
Home Financials for this Owner
Home Financials are based on the most recent Mortgage that was taken out on this home.
Original Mortgage
$200,000
Interest Rate
6.49%
Create a Home Valuation Report for This Property
The Home Valuation Report is an in-depth analysis detailing your home's value as well as a comparison with similar homes in the area
Home Values in the Area
Average Home Value in this Area
Purchase History
| Date | Buyer | Sale Price | Title Company |
|---|---|---|---|
| Hayes Jane T | $155,000 | -- | |
| Morgan Michael P | $136,300 | -- |
Source: Public Records
Mortgage History
| Date | Status | Borrower | Loan Amount |
|---|---|---|---|
| Previous Owner | Hayes Jane T | $139,500 | |
| Previous Owner | Morgan Michael P | $200,000 |
Source: Public Records
Tax History
| Year | Tax Paid | Tax Assessment Tax Assessment Total Assessment is a certain percentage of the fair market value that is determined by local assessors to be the total taxable value of land and additions on the property. | Land | Improvement |
|---|---|---|---|---|
| 2025 | $5,940 | $144,620 | $56,550 | $88,070 |
| 2024 | $5,940 | $144,620 | $56,550 | $88,070 |
| 2023 | $5,854 | $144,620 | $56,550 | $88,070 |
| 2022 | $5,759 | $144,620 | $56,550 | $88,070 |
| 2021 | $5,660 | $144,620 | $56,550 | $88,070 |
| 2020 | $5,513 | $144,620 | $56,550 | $88,070 |
| 2019 | $5,410 | $144,620 | $56,550 | $88,070 |
| 2018 | $5,347 | $144,620 | $56,550 | $88,070 |
| 2017 | $5,221 | $144,620 | $56,550 | $88,070 |
| 2016 | $4,294 | $144,620 | $56,550 | $88,070 |
| 2015 | $4,294 | $144,620 | $56,550 | $88,070 |
| 2014 | $4,294 | $144,620 | $56,550 | $88,070 |
Source: Public Records
Map
Nearby Homes
- 112 Lindley Ln
- 2126 Robin Ln
- 1250 New Philadelphia Rd
- 1630 Sheeder Mill Rd
- 204 Nottingham Dr
- 3211 Coventryville Rd
- 105 Wilson Rd
- 1672 Hollow Rd
- 100 Maack Rd
- 826 Graphite Dr
- 1284 School House Ln
- 1547 Pottstown Pike
- 3896 Coventryville Rd
- 287 Kulp Rd
- 1700 Saint Matthews Rd
- 591 W Hoffecker Rd
- 723 Saylors Mill Rd
- 2800 Horseshoe Trail
- 244 Harley Rd
- 746 W Hoffecker Rd
- 98 Bertolet School Rd
- 97 Bertolet School Rd
- 704 Pughtown Rd
- 0 Bertolet School Rd
- 703 Pughtown Rd
- 620 Pughtown Rd
- 96 Bertolet School Rd
- 706 Pughtown Rd
- 20 Highgate Cir
- 615 Pughtown Rd
- 60 Paddock Cir
- 616 Pughtown Rd
- 64 Paddock Cir
- 88 Bertolet School Rd
- 24 Highgate Cir
- 68 Paddock Cir
- 614 Pughtown Rd
- 61 Paddock Cir
- 86 Bertolet School Rd
- 25 Highgate Cir
Your Personal Tour Guide
Ask me questions while you tour the home.