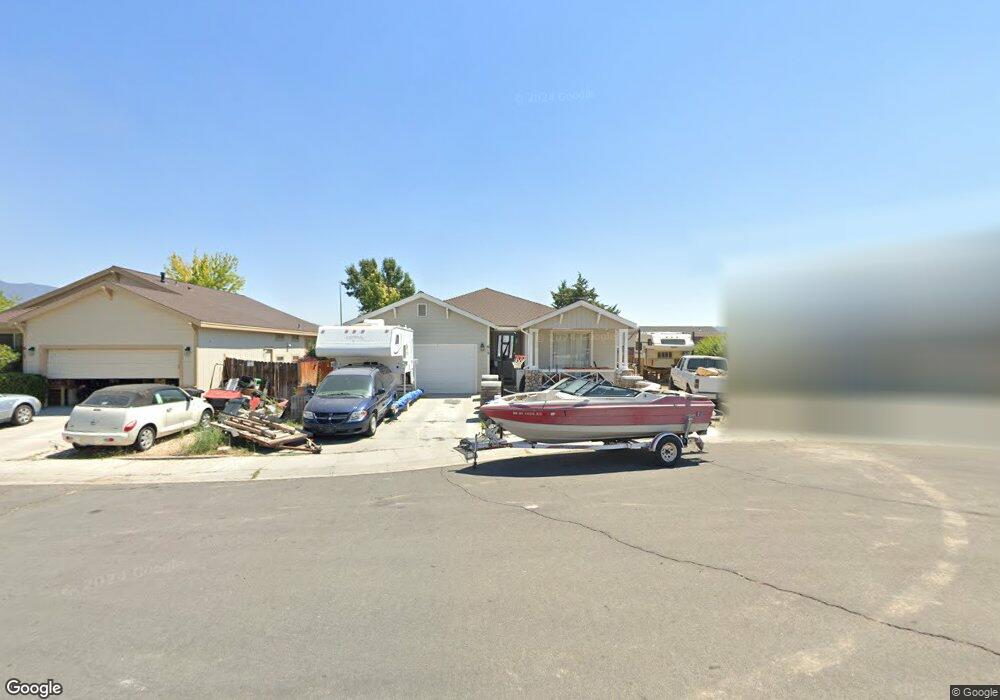
619 Rock Island Dr Dayton, NV 89403
Estimated Value: $371,000 - $377,000
3
Beds
2
Baths
1,160
Sq Ft
$323/Sq Ft
Est. Value
About This Home
This home is located at 619 Rock Island Dr, Dayton, NV 89403 and is currently estimated at $375,011, approximately $323 per square foot. 619 Rock Island Dr is a home located in Lyon County with nearby schools including Sutro Elementary School, Dayton Intermediate School, and Dayton High School.
Ownership History
Date
Name
Owned For
Owner Type
Purchase Details
Closed on
Mar 13, 2018
Sold by
Bradley Alannah B and Bradley David W
Bought by
Hall Scott
Current Estimated Value
Home Financials for this Owner
Home Financials are based on the most recent Mortgage that was taken out on this home.
Original Mortgage
$213,069
Outstanding Balance
$191,147
Interest Rate
6.6%
Mortgage Type
FHA
Estimated Equity
$183,864
Purchase Details
Closed on
Aug 23, 2015
Sold by
Amling Darrell and Mccarthy Chris
Bought by
Bradley Alannah B and Bradley David W
Home Financials for this Owner
Home Financials are based on the most recent Mortgage that was taken out on this home.
Original Mortgage
$132,900
Interest Rate
3.86%
Mortgage Type
New Conventional
Purchase Details
Closed on
Nov 1, 2011
Sold by
Hsbc Bank Usa National Association
Bought by
Amling Darrell and Mccarthy Chris
Purchase Details
Closed on
Jul 25, 2011
Sold by
Hart Stephanie D and Cooper Michael T
Bought by
Hsbc Bank Usa National Association
Create a Home Valuation Report for This Property
The Home Valuation Report is an in-depth analysis detailing your home's value as well as a comparison with similar homes in the area
Home Values in the Area
Average Home Value in this Area
Purchase History
| Date | Buyer | Sale Price | Title Company |
|---|---|---|---|
| Hall Scott | $217,000 | Ticor Title Carson City | |
| Bradley Alannah B | $152,900 | First Centennial Reno | |
| Amling Darrell | $64,500 | None Available | |
| Hsbc Bank Usa National Association | $84,150 | Accommodation |
Source: Public Records
Mortgage History
| Date | Status | Borrower | Loan Amount |
|---|---|---|---|
| Open | Hall Scott | $213,069 | |
| Previous Owner | Bradley Alannah B | $132,900 |
Source: Public Records
Tax History Compared to Growth
Tax History
| Year | Tax Paid | Tax Assessment Tax Assessment Total Assessment is a certain percentage of the fair market value that is determined by local assessors to be the total taxable value of land and additions on the property. | Land | Improvement |
|---|---|---|---|---|
| 2025 | $1,541 | $105,659 | $57,750 | $47,909 |
| 2024 | $1,496 | $106,049 | $57,750 | $48,298 |
| 2023 | $1,496 | $103,072 | $57,750 | $45,322 |
| 2022 | $1,180 | $89,787 | $48,090 | $41,697 |
| 2021 | $1,146 | $84,538 | $43,785 | $40,753 |
| 2020 | $1,112 | $83,114 | $43,790 | $39,324 |
| 2019 | $1,079 | $67,187 | $29,190 | $37,997 |
| 2018 | $1,048 | $58,151 | $21,000 | $37,151 |
| 2017 | $1,018 | $51,216 | $14,000 | $37,216 |
| 2016 | $992 | $42,273 | $7,880 | $34,393 |
| 2015 | $990 | $33,253 | $7,880 | $25,373 |
| 2014 | $961 | $30,090 | $7,880 | $22,210 |
Source: Public Records
Map
Nearby Homes
- 628 Rock Island Dr
- 300 Golden Pick Dr
- 201 Crown Point Dr
- 298 Monte Cristo Dr
- 618 Union Rd
- 618 Union Rd Unit Lot 67
- 463 Sheep Camp Dr
- 539 Rawe Peak Dr
- 467 Sheep Camp Dr
- 469 Sheep Camp Dr
- WASHOE Plan at Amber Ridge
- YOSEMITE Plan at Amber Ridge
- TAHOE Plan at Amber Ridge
- TOPAZ Plan at Amber Ridge
- 471 Sheep Camp Dr Unit Lot 139
- 697 Canon Rd
- 697 Canon Rd Unit Homesite 45
- 695 Canon Rd Unit Homesite 46
- 695 Canon Rd
- 473 Sheep Camp Dr Unit Lot 140
- 617 Rock Island Dr
- 621 Rock Island Dr
- 432 Sheep Camp Dr
- 430 Sheep Camp Dr
- 434 Sheep Camp Dr
- 615 Rock Island Dr
- 623 Rock Island Dr
- 624 Rock Island Dr
- 428 Sheep Camp Dr
- 436 Sheep Camp Dr
- 613 Rock Island Dr
- 426 Sheep Camp Dr
- 616 Rock Island Dr
- 626 Rock Island Dr
- 256 Monte Cristo Dr
- 611 Rock Island Dr
- 627 Rock Island Dr
- 154 Dayton Village Pkwy
- 152 Dayton Village Pkwy
- 614 Rock Island Dr