Estimated Value: $526,853 - $556,000
4
Beds
3
Baths
1,848
Sq Ft
$295/Sq Ft
Est. Value
About This Home
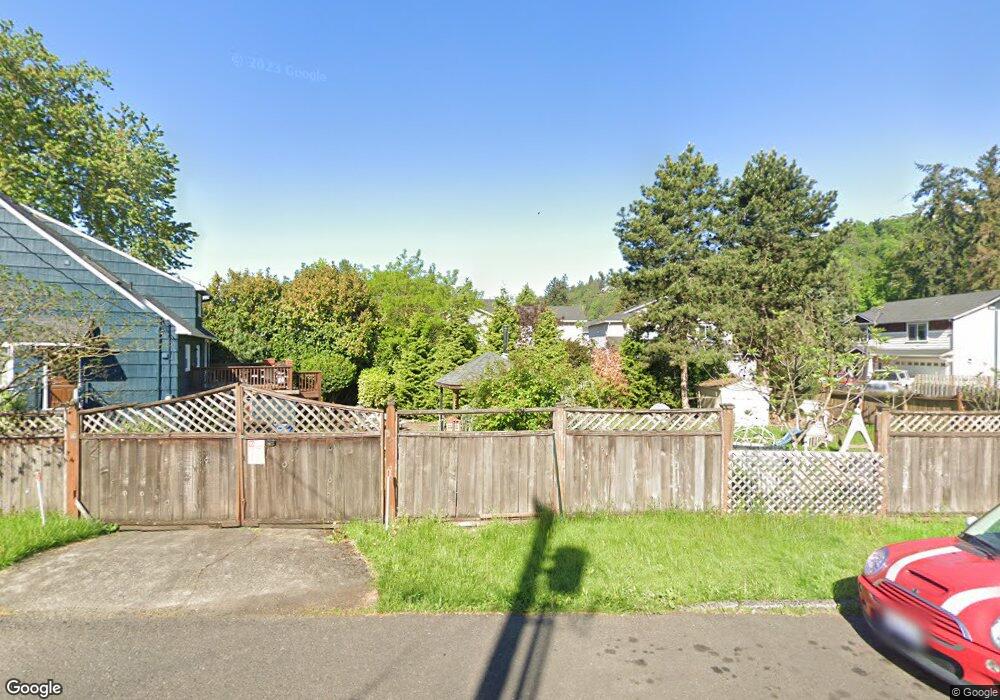
This home is located at 619 SW Sierra St, Camas, WA 98607 and is currently estimated at $545,463, approximately $295 per square foot. 619 SW Sierra St is a home located in Clark County with nearby schools including Prune Hill Elementary School, Skyridge Middle School, and Camas High School.
Ownership History
Date
Name
Owned For
Owner Type
Purchase Details
Closed on
Mar 11, 2015
Sold by
Fannie Mae
Bought by
Young Michael and Young Amy
Current Estimated Value
Home Financials for this Owner
Home Financials are based on the most recent Mortgage that was taken out on this home.
Original Mortgage
$9,118
Outstanding Balance
$6,976
Interest Rate
3.65%
Mortgage Type
Unknown
Estimated Equity
$538,487
Purchase Details
Closed on
Nov 9, 2011
Sold by
Casey Dann D
Bought by
Federal National Mortgage Association
Purchase Details
Closed on
Jun 15, 2007
Sold by
Palace Construction Corp
Bought by
Casey Dann D
Home Financials for this Owner
Home Financials are based on the most recent Mortgage that was taken out on this home.
Original Mortgage
$232,650
Interest Rate
6.16%
Mortgage Type
Purchase Money Mortgage
Create a Home Valuation Report for This Property
The Home Valuation Report is an in-depth analysis detailing your home's value as well as a comparison with similar homes in the area
Home Values in the Area
Average Home Value in this Area
Purchase History
| Date | Buyer | Sale Price | Title Company |
|---|---|---|---|
| Young Michael | -- | Chicago Title Insurance | |
| Federal National Mortgage Association | $216,139 | First American Title | |
| Casey Dann D | $258,500 | First American Title |
Source: Public Records
Mortgage History
| Date | Status | Borrower | Loan Amount |
|---|---|---|---|
| Open | Young Michael | $9,118 | |
| Open | Young Michael | $227,950 | |
| Previous Owner | Casey Dann D | $232,650 |
Source: Public Records
Tax History Compared to Growth
Tax History
| Year | Tax Paid | Tax Assessment Tax Assessment Total Assessment is a certain percentage of the fair market value that is determined by local assessors to be the total taxable value of land and additions on the property. | Land | Improvement |
|---|---|---|---|---|
| 2025 | $4,478 | $379,616 | $92,500 | $287,116 |
| 2024 | $4,113 | $469,540 | $154,100 | $315,440 |
| 2023 | $4,481 | $463,507 | $149,700 | $313,807 |
| 2022 | $4,097 | $480,376 | $149,700 | $330,676 |
| 2021 | $4,140 | $367,144 | $112,300 | $254,844 |
| 2020 | $4,021 | $343,934 | $103,500 | $240,434 |
| 2019 | $3,849 | $309,740 | $92,500 | $217,240 |
| 2018 | $3,716 | $315,845 | $0 | $0 |
| 2017 | $3,367 | $256,295 | $0 | $0 |
| 2016 | $2,929 | $252,914 | $0 | $0 |
| 2015 | $2,770 | $218,862 | $0 | $0 |
| 2014 | -- | $195,137 | $0 | $0 |
| 2013 | -- | $176,241 | $0 | $0 |
Source: Public Records
Map
Nearby Homes
- 1938 NW Sierra Ln
- 2229 NW 6th Place
- 2311 SW 6th Ave Unit 8B
- 2311 SW 6th Ave Unit D2
- 2311 SW 6th Ave Unit 9
- 2012 NW Sierra Ln
- 2508 SW 6th Ave
- 630 SW Zillah St
- 1945 NW 7th Ave
- 1339 NW 7th Ave
- 645 NW Garden Ct Unit LOT 20
- 590 NW Garden Ct Unit LOT 24
- 682 NW Ct Unit Lot 26
- 630 NW Halifax St Unit Lot 15
- 863 NW Norwood Ct
- 732 NW Garden Ct Unit Lot 27
- 533 NW Halifax St
- 645 NW Halifax St Unit Lot 7
- 0 NW Garden Ct Unit 24028974
- 0 NW Halifax Unit Lot 6 24459237
- 623 SW Sierra St
- 2025 SW 6th Ave
- 620 SW Trout Ct
- 616 SW Trout Ct
- 2017 SW 6th Ave
- 2031 SW 6th Ave
- 627 SW Sierra St
- 630 SW Trout Ct
- 639 SW Sierra St
- 2043 SW 6th Ave
- 638 SW Trout Ct
- 610 SW Trout Ct
- 2020 SW 6th Ave
- 617 SW Trout Ct
- 640 SW Trout Ct
- 2040 SW 6th Ave
- 636 SW Sierra St
- 1940 SW 6th Ave
- 2050 SW 6th Ave