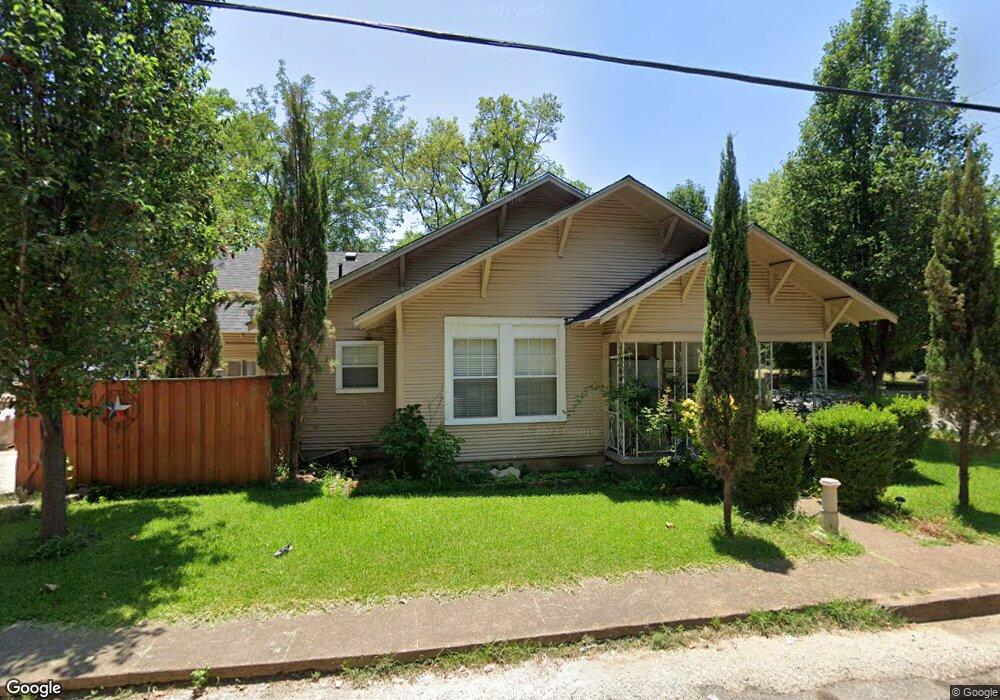
619 W 7th St Bonham, TX 75418
Estimated Value: $111,276 - $163,000
--
Bed
--
Bath
1,149
Sq Ft
$124/Sq Ft
Est. Value
About This Home
This home is located at 619 W 7th St, Bonham, TX 75418 and is currently estimated at $142,319, approximately $123 per square foot. 619 W 7th St is a home located in Fannin County with nearby schools including Finley-Oates Elementary School, LH Rather Jr High School, and Morning Star Academy.
Ownership History
Date
Name
Owned For
Owner Type
Purchase Details
Closed on
Oct 30, 2009
Sold by
Renshaw John and Davis Lanney
Bought by
Avila Jhonny and Diaz Ulga
Current Estimated Value
Home Financials for this Owner
Home Financials are based on the most recent Mortgage that was taken out on this home.
Original Mortgage
$40,500
Interest Rate
4.9%
Mortgage Type
Purchase Money Mortgage
Purchase Details
Closed on
Aug 18, 2005
Sold by
Renshaw Carroll Aileen
Bought by
Renshaw John Charles
Create a Home Valuation Report for This Property
The Home Valuation Report is an in-depth analysis detailing your home's value as well as a comparison with similar homes in the area
Home Values in the Area
Average Home Value in this Area
Purchase History
| Date | Buyer | Sale Price | Title Company |
|---|---|---|---|
| Avila Jhonny | -- | None Available | |
| Renshaw John Charles | -- | None Available |
Source: Public Records
Mortgage History
| Date | Status | Borrower | Loan Amount |
|---|---|---|---|
| Closed | Avila Jhonny | $40,500 |
Source: Public Records
Tax History Compared to Growth
Tax History
| Year | Tax Paid | Tax Assessment Tax Assessment Total Assessment is a certain percentage of the fair market value that is determined by local assessors to be the total taxable value of land and additions on the property. | Land | Improvement |
|---|---|---|---|---|
| 2025 | $570 | $89,670 | $28,660 | $61,010 |
| 2024 | $570 | $94,290 | $28,320 | $65,970 |
| 2023 | $1,098 | $85,830 | $19,110 | $66,720 |
| 2022 | $1,113 | $79,440 | $12,810 | $66,630 |
| 2021 | $1,163 | $59,490 | $8,040 | $51,450 |
| 2020 | $1,069 | $55,500 | $6,470 | $49,030 |
| 2019 | $1,010 | $56,140 | $3,700 | $52,440 |
| 2018 | $917 | $36,470 | $3,490 | $32,980 |
| 2017 | $803 | $31,420 | $3,050 | $28,370 |
| 2016 | $779 | $30,480 | $5,150 | $25,330 |
| 2015 | -- | $29,830 | $4,830 | $25,000 |
| 2014 | -- | $29,690 | $4,830 | $24,860 |
Source: Public Records
Map
Nearby Homes